Examining the log output
In the previous chapter, we mentioned that our app was running in debug mode on the emulator or real device so that we can monitor it and get feedback when things go wrong. So where is all this feedback then?
You might have noticed a whole load of scrolling text at the bottom of the Android Studio window. If not, click on the logcat tab, as shown by the highlighted area labelled as 1 in the following screenshot:
Note
Note that the emulator must be running, or a real device must be attached in debugging mode, for you to see the following window. Furthermore, if you restarted Android Studio for some reason and have not yet executed the app, then the logcat window will be empty. Refer to the first chapter to get the app running on an emulator or a real device:
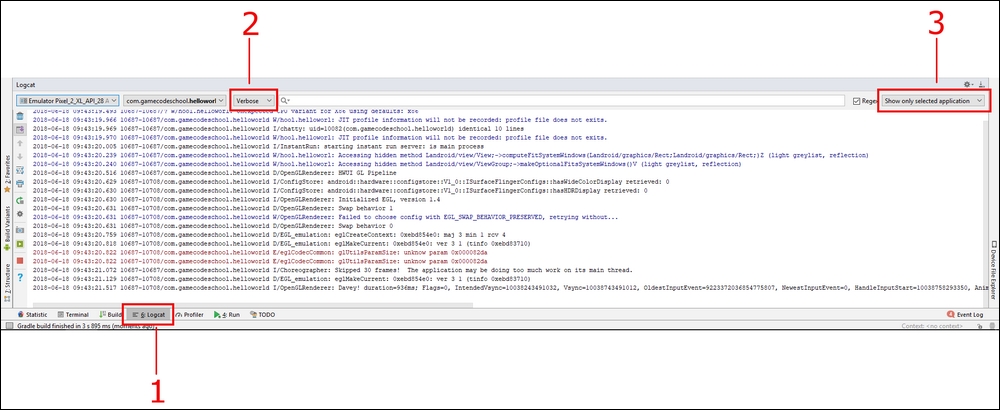
You can drag the window to make it taller, just like you can in most other Windows applications, if you want to see more.
This window is called the logcat, or sometimes it is referred to as the console. It is our app...


