Harnessing factor data using pandas_datareader
Diversification is great until the entire market declines in value. That’s because the overall market influences all assets. Factors can offset some of these risks by targeting drivers of return not influenced by the market. Common factors are size (large-cap versus small-cap) and style (value versus growth). If you think small-cap stocks will outperform large-cap stocks, then you might want exposure to small-cap stocks. If you think value stocks will outperform growth stocks, then you might want exposure to value stocks. In either case, you want to measure the risk contribution of the factor. Eugene Fama and Kenneth French built the Fama-French three-factor model in 1992. The three Fama-French factors are constructed using six value-weight portfolios formed on capitalization and book-to-market.
The three factors are as follows:
- Small Minus Big, which represents the differential between the average returns of three small-cap portfolios and three large-cap portfolios.
- High Minus Low, which quantifies the difference in average returns between two value-oriented portfolios and two growth-oriented portfolios.
- Rm-Rf, which denotes the market’s excess return over the risk-free rate.
We’ll explore how to measure and isolate alpha in Chapter 5, Build Alpha Factors for Stock Portfolios. This recipe will guide you through the process of using pandas_datareader to fetch historic factor data for use in your analysis.
Getting ready…
By now, you should have the OpenBB Platform installed in your virtual environment. If not, go back to the beginning of this chapter and get it set up. By installing the OpenBB Platform, pandas_datareader will be installed and ready to use.
How to do it…
Using the pandas_datareader library, we have access to dozens of investment research factors:
- Import
pandas_datareader:import pandas_datareader as pdr
- Download the monthly factor data starting in January 2000:
factors = pdr.get_data_famafrench("F-F_Research_Data_Factors") - Get a description of the research data factors:
print(factors[“DESCR”])
The result is an explanation of the data included in the DataFrame:

Figure 1.12: Preview of the description that is downloaded with factor data
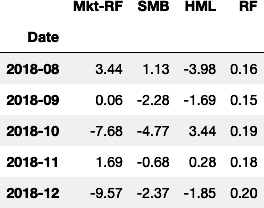
- Inspect the monthly factor data:
print(factors[0].head())
By running the preceding code, we get a DataFrame containing monthly factor data:

Figure 1.13: Preview of the monthly data downloaded from the Fama-French Data Library
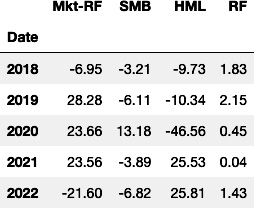
- Inspect the annual factor data:
print(factors[1].head())
By running the preceding code, we get a DataFrame containing annual factor data:

Figure 1.14: Preview of the annual data downloaded from the Fama-French Data Library
How it works…
Under the hood, pandas_datareader fetches data from the Fama-French Data Library by downloading a compressed CSV file, uncompressing it, and creating a pandas DataFrame.
There are 297 different datasets with different factor data available from the Fama-French Data Library. Here are some popular versions of the Fama-French 3-factor model for different regions:
Developed_3_FactorsDeveloped_ex_US_3_FactorsEurope_3_FactorsJapan_3_FactorsAsia_Pacific_ex_Japan_3_Factors
You can use these in the get_data_famafrench method, just like F-F_Research_Data_Factors.
Some datasets return a dictionary with more than one DataFrame representing data for different time frames, portfolio weighting methodologies, and aggregate statistics. Data for these portfolios can be accessed using numerical keys. For example, the 5_Industry_Portfolios dataset returns eight DataFrames in the dictionary. The first can be accessed using the 0 key, the second using the 1 key, and so on. Each dictionary includes a description of the dataset, which can be accessed using the DESCR key.
There’s more…
pandas_datareader can be used to access data from many remote online sources. These include Tiingo, IEX, Alpha Vantage, FRED, Eurostat, and many more. Review the full list of data sources on the documentation page: https://pandas-datareader.readthedocs.io/en/latest/remote_data.html.
See also
For more details on the factors available in the investment factor research library, take a look at the following resources. For another example of using the Fama-French 3-factor model, see the resources on the PyQuant News website:
- Documentation for all the Fama-French factor data: https://mba.tuck.dartmouth.edu/pages/faculty/ken.french/data_library.html
- Details on the Fama-French 3-factor model: https://mba.tuck.dartmouth.edu/pages/faculty/ken.french/Data_Library/f-f_factors.html
- Code walkthrough for using the Fama-French 3-factor model: https://www.pyquantnews.com/past-pyquant-newsletter-issues


