Implementing a donut chart with D3
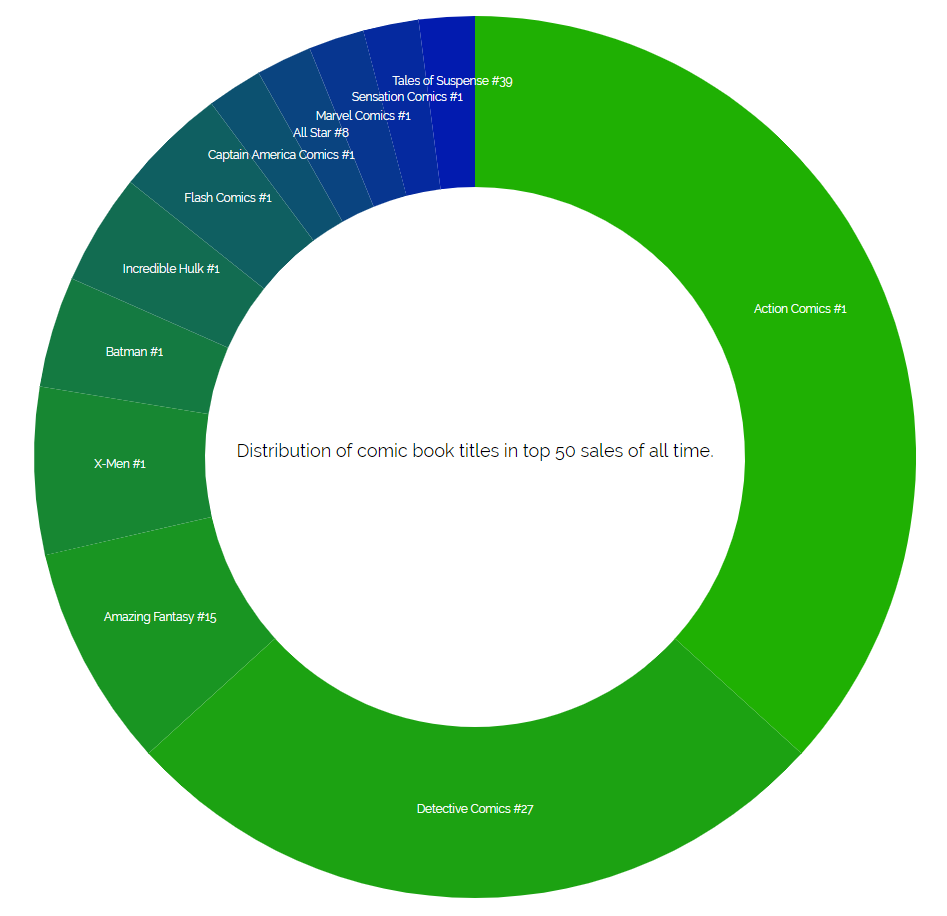
This next sample illustrates another basic data visualization: in this case, a donut chart. Slightly more complicated than a pie chart, this visualization illustrates some new features of D3. When complete, the visualization will look like the following screenshot.
It represents the distribution of individual comic books (referenced by title and issue number) among the top 50 comic book sales of all time (public sales, at the time of writing). There are a few comics that dominate lists like that and this chart will show which ones dominate the most:

The data looks like the following CSV:
title,numbers
"Action Comics #1",18
"All Star #8", 1
"Amazing Fantasy #15",4
"Batman #1",2
"Captain America Comics #1", 1
"Detective Comics #27",13
"Flash Comics #1", 2
"Incredible Hulk #1", 2
"Marvel Comics #1", 1
"Sensation Comics #1", 1
"Tales of Suspense #39", 1
"X-Men #1", 3
The HTML file is very simple. It includes, once again, Raleway, Bootstrap, d3-fetch, and...


