Debugging your app
Debugging is an important part of software development. Small mistakes, strange behaviors, and complex bugs can be solved with the help of debugging. With debugging, we can do the following:
- Make logic assertions
- Determine the required improvements
- Find memory leaks
- Perform flow analysis
Flutter provides multiple tools to help you debug your app, but the easiest way to debug is via the IDE, so let’s start there.
Debugging in the IDE
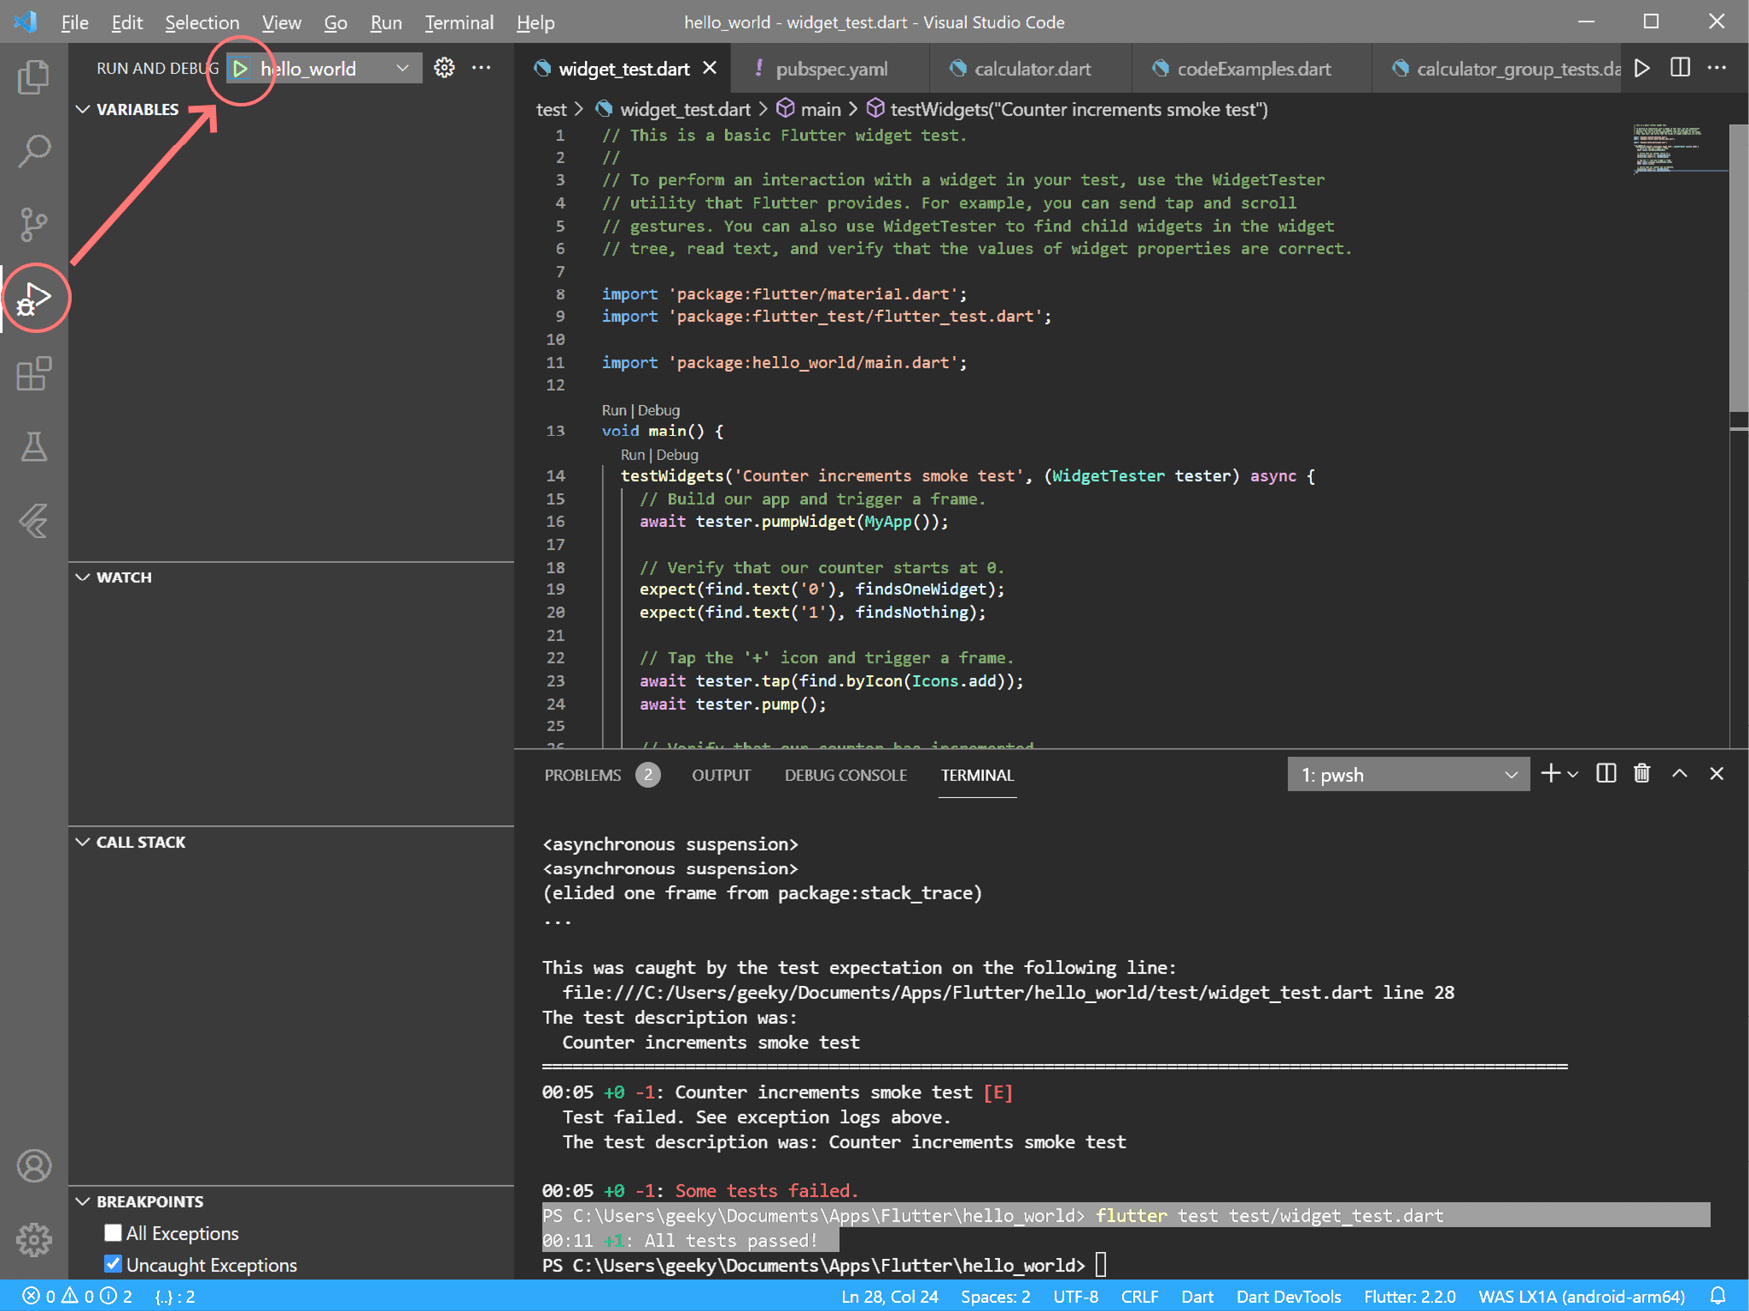
To be able to debug within your IDE, you first need to run your app from within your IDE. If you are running Visual Studio Code, then you will see a RUN AND DEBUG button on the left-hand side of the IDE, which looks like an arrow with a bug on it. Click this; at the top of the section, you will see a Run debugging button beside the name of the Flutter project, hello_world:

Figure 12.1 – Running Flutter from Visual Studio Code
Note that you may need to add a reference...


