Formatting the tooltip with HTML
In the previous chapter, we wrote a considerably large amount of code to modify the output of the tooltip. In this section, we will take that knowledge even further by introducing the country names in the tooltip, using as an example the Olympics medal table from Chapter 2, Column and Bar Charts.
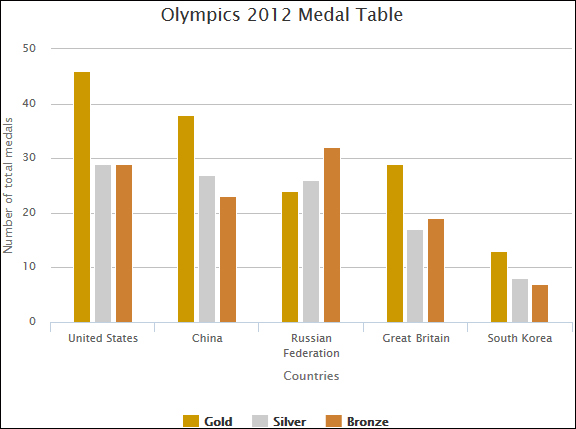
A simple thing we can start with is to change each series color based on the type of medal it represents, as shown in the following code:
series: [{
  name: 'Gold',
  data: [46, 38, 24, 29, 13],
  color: '#cc9900'
}, {
  name: 'Silver',
  data: [29, 27, 26, 17, 8],
  color: '#cccccc'
}, {
  name: 'Bronze',
  data: [29, 23, 32, 19, 7],
  color: '#cd7f32'
}]
The preceding code will give the following result:

We can now actually begin with the tooltip customization. I have downloaded the flags of the plotted countries and have put them inside the img folder. We will first check for the country that is being hovered—the category at the xAxis. Based on country, we will show...


