Understanding the concepts of OpenTelemetry
OpenTelemetry is a large ecosystem. Before diving into the code, having a general understanding of the concepts and terminology used in the project will help us. The project is composed of the following:
- Signals
- Pipelines
- Resources
- Context propagation
Let's look at each of these aspects.
Signals
With its goal of providing an open specification for encompassing such a wide variety of telemetry data, the OpenTelemetry project needed to agree on a term to organize the categories of concern. Eventually, it was decided to call these signals. A signal can be thought of as a standalone component that can be configured, providing value on its own. The community decided to align its work into deliverables around these signals to deliver value to its users as soon as possible. The alignment of the work and separation of concerns in terms of signals has allowed the community to focus its efforts. The tracing and baggage signals were released in early 2021, soon followed by the metrics signal. Each signal in OpenTelemetry comes with the following:
- A set of specification documents providing guidance to implementors of the signal
- A data model expressing how the signal is to be represented in implementations
- An API that can be used by application and library developers to instrument their code
- The SDK needed to allow users to produce telemetry using the APIs
- Semantic conventions that can be used to get consistent, high-quality data
- Instrumentation libraries to simplify usage and adoption
The initial signals defined by OpenTelemetry were tracing, metrics, logging, and baggage. Signals are a core concept of OpenTelemetry and, as such, we will become quite familiar with them.
Specification
One of the most important aspects of OpenTelemetry is ensuring that users can expect a similar experience regardless of the language they're using. This is accomplished by defining the standards for what is expected of OpenTelemetry-compliant implementations in an open specification. The process used for writing the specification is flexible, but large new features or sections of functionality are often proposed by writing an OpenTelemetry Enhancement Proposal (OTEP). The OTEP is submitted for review and is usually provided along with prototype code in multiple languages, to ensure the proposal isn't too language-specific. Once an OTEP is approved and merged, the writing of the specification begins. The entire specification lives in a repository on GitHub (https://github.com/open-telemetry/opentelemetry-specification) and is open for anyone to contribute or review.
Data model
The data model defines the representation of the components that form a specific signal. It provides the specifics of what fields each component must have and describes how all the components interact with one another. This piece of the signal definition is particularly important to give clarity as to what use cases the APIs and SDKs will support. The data model also explains to developers implementing the standard how the data should behave.
API
Instrumenting applications can be quite expensive, depending on the size of your code base. Providing users with an API allows them to go through the process of instrumenting their code in a way that is vendor-agnostic. The API is decoupled from the code that generates the telemetry, allowing users the flexibility to swap out the underlying implementations as they see fit. This interface can also be relied upon by library and frameworks authors, and only configured to emit telemetry data by end users who wish to do so. A user who instruments their code by using the API and does not configure the SDK will not see any telemetry produced by design.
SDK
The SDK does the bulk of the heavy lifting in OpenTelemetry. It implements the underlying system that generates, aggregates, and transmits telemetry data. The SDK provides the controls to configure how telemetry should be collected, where it should be transmitted, and how. Configuration of the SDK is supported via in-code configuration, as well as via environment variables defined in the specification. As it is decoupled from the API, using the SDK provided by OpenTelemetry is an option for users, but it is not required. Users and vendors are free to implement their own SDKs if doing so will better fit their needs.
Semantic conventions
Producing telemetry can be a daunting task, since you can call anything whatever you wish, but doing so would make analyzing this data difficult. For example, if server A labels the duration of an http.server.duration request and server B labels it http.server.request_length, calculating the total duration of a request across both servers requires additional knowledge of this difference, and likely additional operations. One way in which OpenTelemetry tries to make this a bit easier is by offering semantic conventions, or definitions for different types of applications and workloads to improve the consistency of telemetry. Some of the types of applications or protocols that are covered by semantic conventions include the following:
- HTTP
- Database
- Message queues
- Function-as-a-Service (FaaS)
- Remote procedure calls (RPC)
- Process metrics
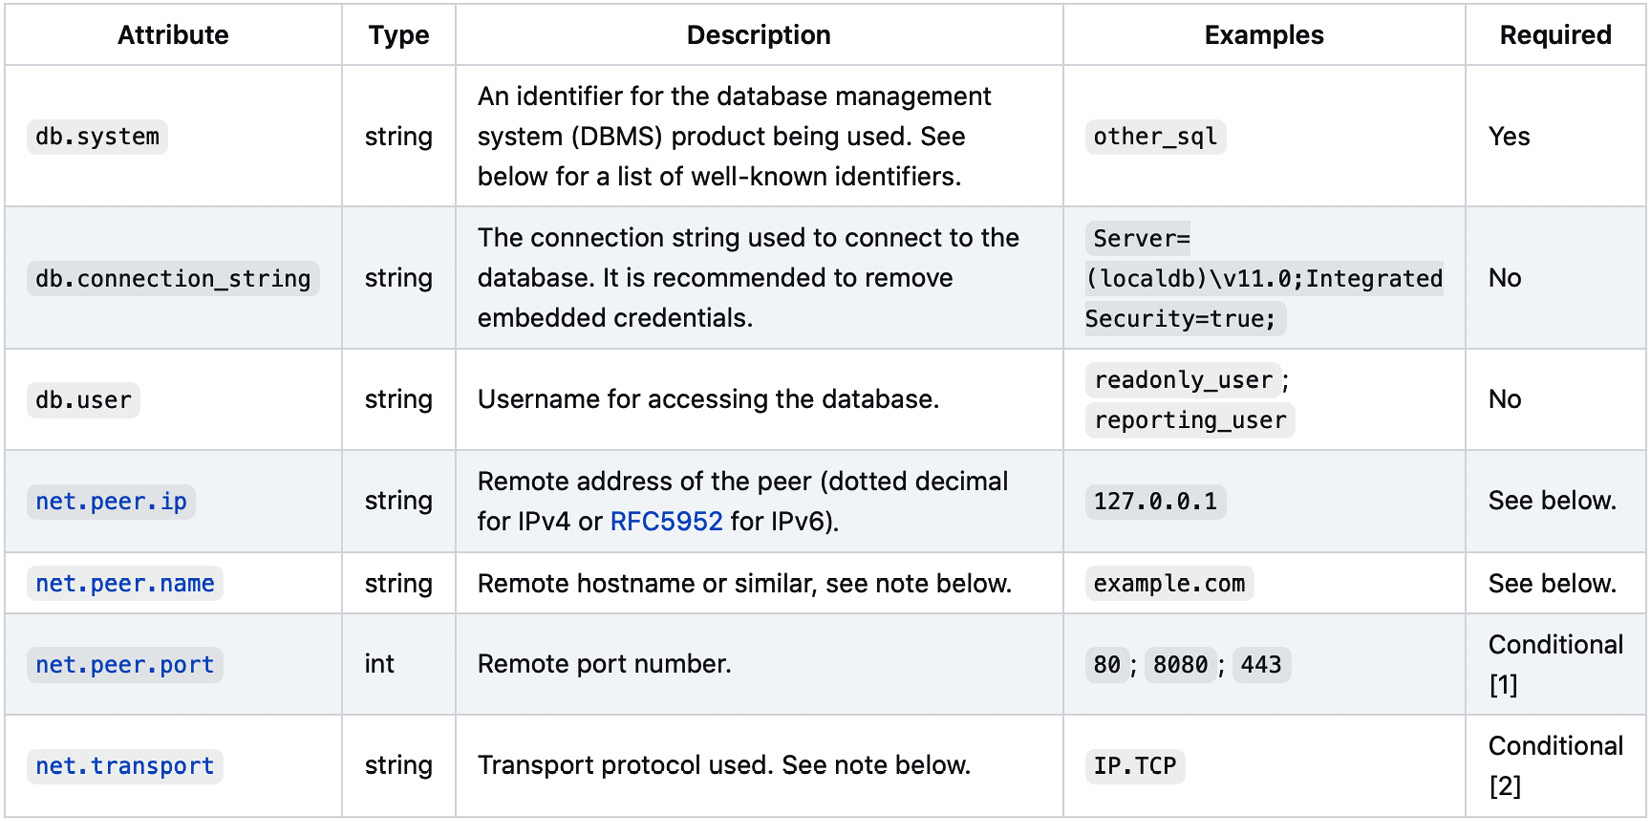
The full list of semantic conventions is quite extensive and can be found in the specification repository. The following figure shows a sample of the semantic convention for tracing database queries:

Table 1.1 – Database semantic conventions as defined in the OpenTelemetry specification (https://github.com/open-telemetry/opentelemetry-specification/blob/main/specification/trace/semantic_conventions/database.md#connection-level-attributes)
The consistency of telemetry data reported will ultimately impact the user of that data's ability to use this information. Semantic conventions provide both the guidelines of what telemetry should be reported, as well as how to identify this data. They provide a powerful tool for developers to learn their way around observability.
Instrumentation libraries
To ensure users can get up and running quickly, instrumentation libraries are made available by OpenTelemetry SIGs in various languages. These libraries provide instrumentation for popular open source projects and frameworks. For example, in Python, the instrumentation libraries include Flask, Requests, Django, and others. The mechanisms used to implement these libraries are language-specific and may be used in combination with auto-instrumentation to provide users with telemetry with close to zero code changes required. The instrumentation libraries are supported by the OpenTelemetry organization and adhere to semantic conventions.
Signals represent the core of the telemetry data that is generated by instrumenting cloud-native applications. They can be used independently, but the real power of OpenTelemetry is to allow its users to correlate data across signals to get a better understanding of their systems. Now that we have a general understanding of what they are, let's look at the other concepts of OpenTelemetry.
Pipelines
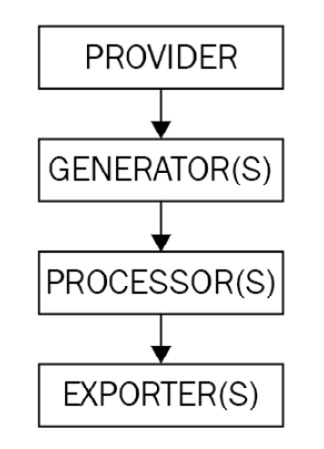
To be useful, the telemetry data captured by each signal must eventually be exported to a data store, where storage and analysis can occur. To accomplish this, each signal implementation offers a series of mechanisms to generate, process, and transmit telemetry. We can think of this as a pipeline, as represented in the following figure:

Figure 1.5 – Telemetry pipeline
The components in the telemetry pipeline are typically initialized early in the application code to ensure no meaningful telemetry is missed.
Important note
In many languages, the pipeline is configurable via environment variables. This will be explored further in Chapter 7, Instrumentation Libraries.
Once configured, the application generally only needs to interact with the generator to record telemetry, and the pipeline will take care of collecting and sending the data. Let's look at each component of the pipeline now.
Providers
The starting point of the telemetry pipeline is the provider. A provider is a configurable factory that is used to give application code access to an entity used to generate telemetry data. Although multiple providers may be configured within an application, a default global provider may also be made available via the SDK. Providers should be configured early in the application code, prior to any telemetry data being generated.
Telemetry generators
To generate telemetry at different points in the code, the telemetry generator instantiated by a provider is made available in the SDK. This generator is what most users will interact with through the instrumentation of their application and the use of the API. Generators are named differently depending on the signal: the tracing signal calls this a tracer, the metrics signal a meter. Their purpose is generally the same – to generate telemetry data. When instantiating a generator, applications and instrumenting libraries must pass a name to the provider. Optionally, users can specify a version identifier to the provider as well. This information will be used to provide additional information in the telemetry data generated.
Processors
Once the telemetry data has been generated, processors provide the ability to further modify the contents of the data. Processors may determine the frequency at which data should be processed or how the data should be exported. When instantiating a generator, applications and instrumenting libraries must pass a name to the provider. Optionally, users can specify a version identifier to the provider as well.
Exporters
The last step before telemetry leaves the context of an application is to go through the exporter. The job of the exporter is to translate the internal data model of OpenTelemetry into the format that best matches the configured exporter's understanding. Multiple export formats and protocols are supported by the OpenTelemetry project:
- OpenTelemetry protocol
- Console
- Jaeger
- Zipkin
- Prometheus
- OpenCensus
The pipeline allows telemetry data to be produced and emitted. We'll configure pipelines many times over the following chapters, and we'll see how the flexibility provided by the pipeline accommodates many use cases.
Resources
At their most basic, resources can be thought of as a set of attributes that are applied to different signals. Conceptually, a resource is used to identify the source of the telemetry data, whether a machine, container, or function. This information can be used at the time of analysis to correlate different events occurring in the same resource. Resource attributes are added to the telemetry data from signals at the export time before the data is emitted to a backend. Resources are typically configured at the start of an application and are associated with the providers. They tend to not change throughout the lifetime of the application. Some typical resource attributes would include the following:
- A unique name for the service:
service.name - The version identifier for a service:
service.version - The name of the host where the service is running:
host.name
Additionally, the specification defines resource detectors to further enrich the data. Although resources can be set manually, resource detectors provide convenient mechanisms to automatically populate environment-specific data. For example, the Google Cloud Platform (GCP) resource detector (https://www.npmjs.com/package/@opentelemetry/resource-detector-gcp) interacts with the Google API to fill in the following data:

Table 1.2 – GCP resource detector attributes
Resources and resource detectors adhere to semantic conventions. Resources are a key component in making telemetry data-rich, meaningful, and consistent across an application. Another important aspect of ensuring the data is meaningful is context propagation.
Context propagation
One area of observability that is particularly powerful and challenging is context propagation. A core concept of distributed tracing, context propagation provides the ability to pass valuable contextual information between services that are separated by a logical boundary. Context propagation is what allows distributed tracing to tie requests together across multiple systems. OpenTelemetry, as OpenTracing did before it, has made this a core component of the project. In addition to tracing, context propagation allows for user-defined values (known as baggage) to be propagated. Baggage can be used to annotate telemetry across signals.
Context propagation defines a context API as part of the OpenTelemetry specification. This is independent of the signals that may use it. Some languages already have built-in context mechanisms, such as the ContextVar module in Python 3.7+ and the context package in Go. The specification recommends that the context API implementations leverage these existing mechanisms. OpenTelemetry also provides for the interface and implementation of mechanisms required to propagate context across boundaries. The following abbreviated code shows how two services, A and B, would use the context API to share context:
from opentelemetry.propagate import extract, inject
class ServiceA:
    def client_request():
        inject(headers, context=current_context)
        # make a request to ServiceB and pass in headers
class ServiceB:
    def handle_request():
        # receive a request from ServiceA
        context = extract(headers)
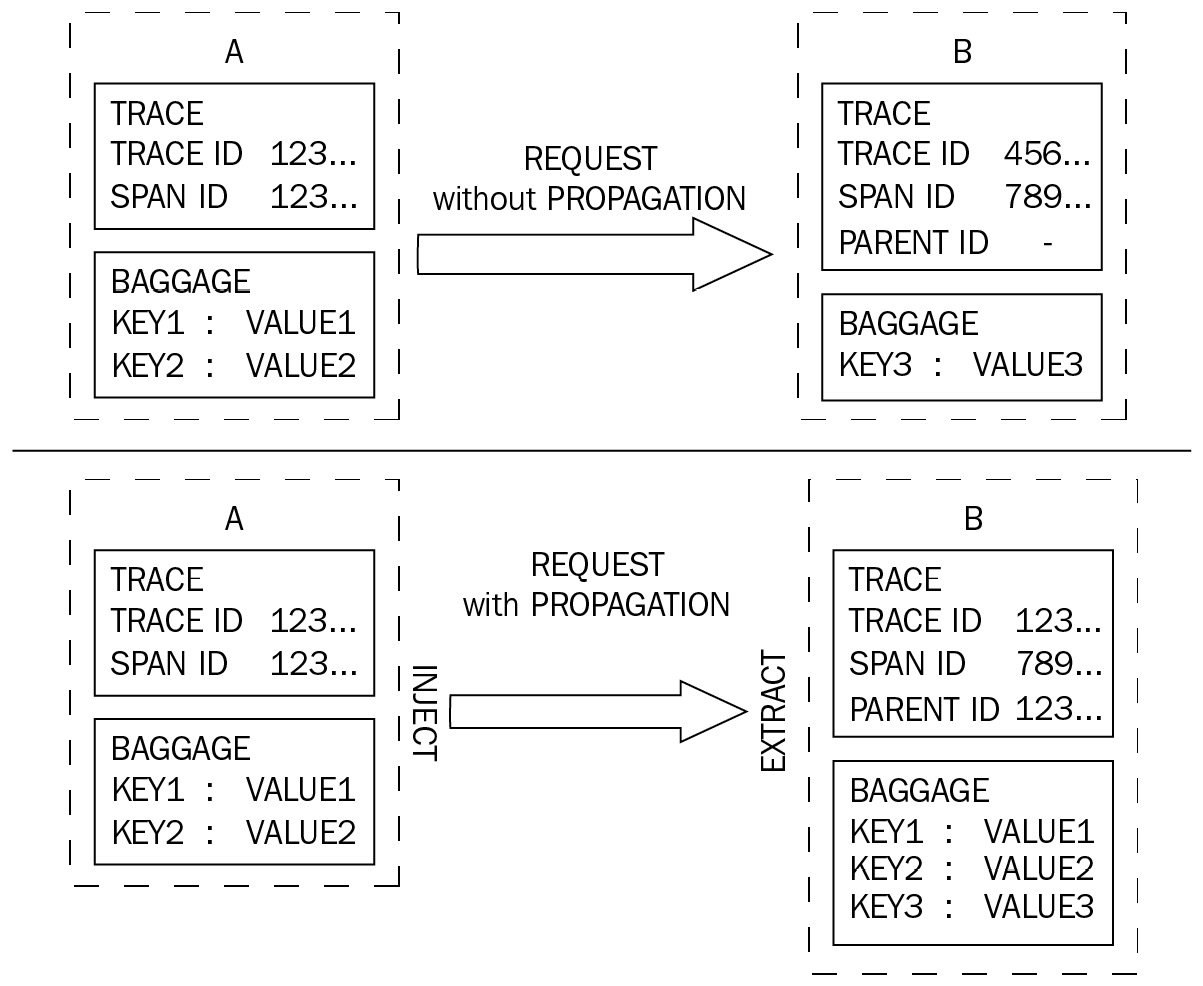
In Figure 1.6, we can see a comparison between two requests from service A to service B. The top request is made without propagating the context, with the result that service B has neither the trace information nor the baggage that service A does. In the bottom request, this contextual data is injected when service A makes a request to service B, and extracted by service B from the incoming request, ensuring service B now has access to the propagated data:

Figure 1.6 – Request between service A and B with and without context propagation
The propagation of context we have demonstrated allows backends to tie the two sides of the request together, but it also allows service B to make use of the dataset in service A. The challenge with context propagation is that when it isn't working, it's hard to know why. The issue could be that the context isn't being propagated correctly due to configuration issues or possibly a networking problem. This is a concept we'll revisit many times throughout the book.


