Multithreading with Taskflow
Modern graphical applications require us to harness the power of multiple CPUs to be performant. Taskflow is a fast C++ header-only library that can help you write parallel programs with complex task dependencies quickly. This library is extremely useful as it allows you to jump into the development of multithreaded graphical applications that make use of advanced rendering concepts, such as frame graphs and multithreaded command buffers generation.
Getting ready
Here, we use Taskflow version 3.1.0. You can download it using the following Bootstrap snippet:
{
  "name": "taskflow",
  "source": {
    "type": "git",
    "url": "https://github.com/taskflow/taskflow.git",
    "revision": "v3.1.0"
  }
}
To debug dependency graphs produced by Taskflow, it is recommended that you install the GraphViz tool from https://www.graphviz.org.
The complete source code for this recipe can be found in Chapter2/09_Taskflow.
How to do it...
Let's create and run a set of concurrent dependent tasks via the for_each() algorithm. Each task will print a single value from an array in a concurrent fashion. The processing order can vary between different runs of the program:
- Include the
taskflow.hppheader file:#include <taskflow/taskflow.hpp> using namespace std; int main() { - The
tf::Taskflowclass is the main place to create a task dependency graph. Declare an instance and a data vector to process:tf::Taskflow taskflow; std::vector<int> items{ 1, 2, 3, 4, 5, 6, 7, 8 }; - The
for_each()member function returns a task that implements a parallel-for loop algorithm. The task can be used for synchronization purposes:auto task = taskflow.for_each( items.begin(), items.end(), [](int item) { std::cout << item; } ); - Let's attach some work before and after the parallel-for task so that we can view
StartandEndmessages in the output. Let's call the newSandTtasks accordingly:taskflow.emplace( []() { std::cout << "\nS - Start\n"; }).name("S").precede(task); taskflow.emplace( []() { std::cout << "\nT - End\n"; }).name("T").succeed(task); - Save the generated tasks dependency graph in
.dotformat so that we can process it later with the GraphVizdottool:std::ofstream os("taskflow.dot"); taskflow.dump(os); - Now we can create an
executorobject and run the constructed taskflow graph:Tf::Executor executor; executor.run(taskflow).wait(); return 0; }
One important part to mention here is that the dependency graph can only be constructed once. Then, it can be reused in every frame to run concurrent tasks efficiently.
The output from the preceding program should look similar to the following listing:
S - Start
39172 runs 6
46424 runs 5
17900 runs 2
26932 runs 1
26932 runs 8
23888 runs 3
45464 runs 7
32064 runs 4
T - End
Here, we can see our S and T tasks. Between them, there are multiple threads with different IDs processing different elements of the items[] vector in parallel.
There's more...
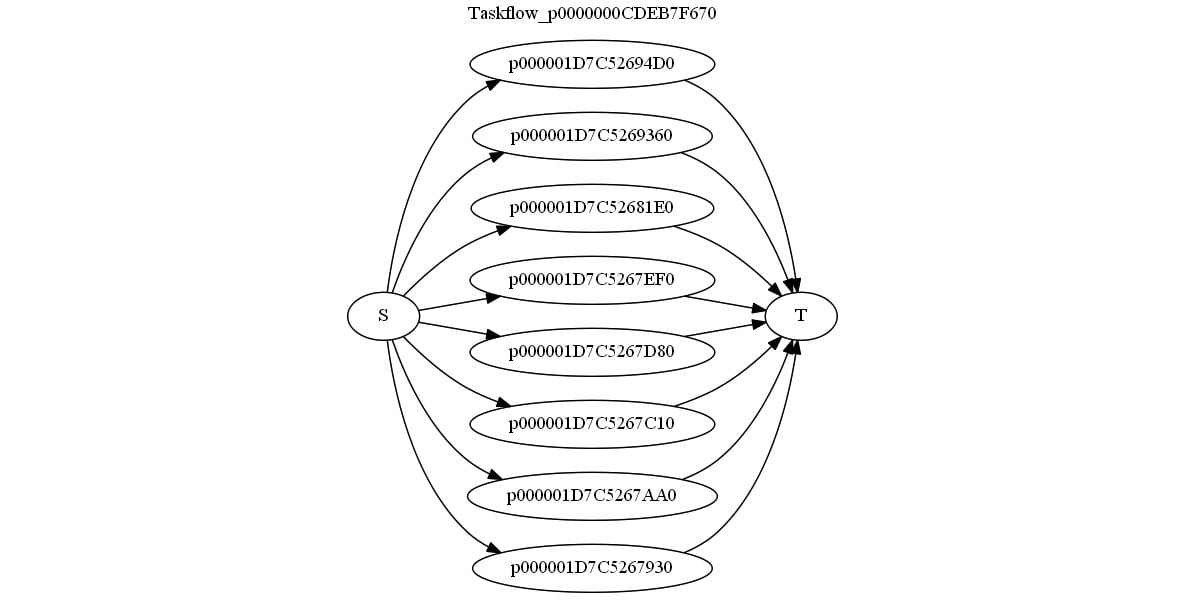
The application saved the dependency graph inside the taskflow.dot file. It can be converted into a visual representation by GraphViz using the following command:
dot -Tpng taskflow.dot > output.png
The resulting .png image should look similar to the following screenshot:

Figure 2.7 – The Taskflow dependency graph for for_each()
This functionality is extremely useful when you are debugging complex dependency graphs (and producing complex-looking images for your books and papers).
The Taskflow library functionality is vast and provides implementations for numerous parallel algorithms and profiling capabilities. Please refer to the official documentation for in-depth coverage at https://taskflow.github.io/taskflow/index.html.


