How to link data in Spotfire
Let's see how table relations work in practice. First, we have to add some new data.
The data used here is BaseballPlayerData.xls and BaseballTeamData.xls, which you can download from http://www.insidespotfire.com.
- Open the baseball analysis file you've been working with.
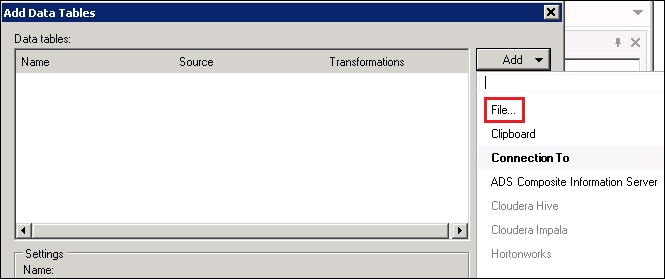
- We're now going to add a second data table to the analysis, so select Add Data Tables… from the File menu.

BaseballTeamData.xlsis a Microsoft Excel spreadsheet derived from the baseball player dataset and contains team-level information only. We'll import it just like we did in the earlier examples, accepting the column definition defaults as before. The only difference is that, this time, you will add the table to an existing analysis. This datafile has one row for each team and provides aggregated values (mainly averages) for all the individual statistics provided by the player data table.- After you add the data table, Spotfire automatically adds a new page with a default visualization.
How to relate two tables
A core feature of Spotfire is the seamless way in which you can interact with multiple visualizations based on multiple data tables. Be patient, we will move on to the visualization part soon, in Chapter 2, Visualize This!. First, you must learn the key technique to link or relate different tables.
We are going to relate the player data table, where each row in the data represents an individual baseball player, with the team data table, where each row represents a baseball team. The obvious link is the team name, so that is how we will relate the two tables. Once related, the single row for, say, team Detroit in table 2 will be linked to the nine rows for team Detroit in table 1.
Note
Data granularity is an important concept. One table here has a finer granularity (player) than the other (team). Such tables can be related through the lowest level of granularity that they share—team, in this case.
Table relations are defined in the analysis file's Data Table Properties.
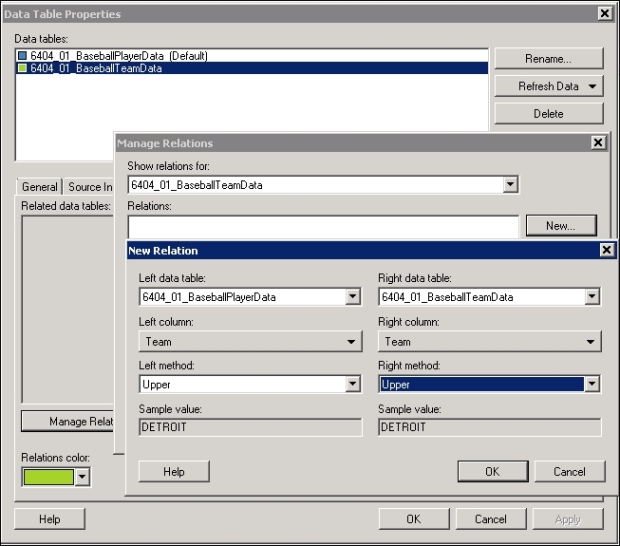
- From the Edit menu, select Data Table Properties. The dialog that opens shows you all the tables currently loaded into your analysis file.

- Navigate to the Relations tab and click on the Manage Relations button and then the New button to get to the table relations dialog.

- Select one table as the left data table and the other as the right table; it doesn't matter which is which. Now you need to decide how these tables are related by selecting the columns through which to connect them. Use the dropdown lists in each case to select Team because that is the common link between these two data tables.
- If you want to define a more flexible matching rule, use the Left Method and Right method dropdown. For example, you could select Upper in both cases. This setting will ensure that the match is case insensitive. The data will not change, and one table might still have Detroit and DETROIT in any given row, but they will match the relationship because they will be converted to all uppercase for matching purposes.
- Finally, click on OK in the New Relation dialog, click on OK in the Manage Relations dialog, and click on OK in the Data Table Properties dialog, noting as you do that both tables have been assigned the same color index, indicating a defined relation.
- You can edit a relation at any time by going back to the Manage Relations dialog, selecting the relation of interest, and clicking on Edit.
- If you need to relate two tables on the basis of more than one column, simply add each relation pair one by one.
Column matching
Another way to relate data in Spotfire is column matching, which is used to determine how multiple tables should be treated when used alongside each other in the same visualization. Spotfire will automatically match columns with the same name, regardless of whether you defined any relationship between the two tables.
You can override Spotfire or add new column matches by performing the following steps.
- Navigate to the Column Matches tab.
- You will notice the three columns already matched by Spotfire.

- You can select and delete any of these columns using the Delete button.
- You can edit any of the matches or you can add a new match. Spotfire will allow you to match any pair as long as they have the same data type. In the screenshot, Team and Position have been selected as a potential match, which doesn't actually make any sense. It does illustrate how important it is to understand all aspects of your data, not just its structure but also the values.


