Search icon CANCEL
Arrow left icon
Explore Products
Best Sellers
New Releases
Books
Videos
Audiobooks
Learning Hub
Conferences
Free Learning
Arrow right icon
Arrow up icon
GO TO TOP
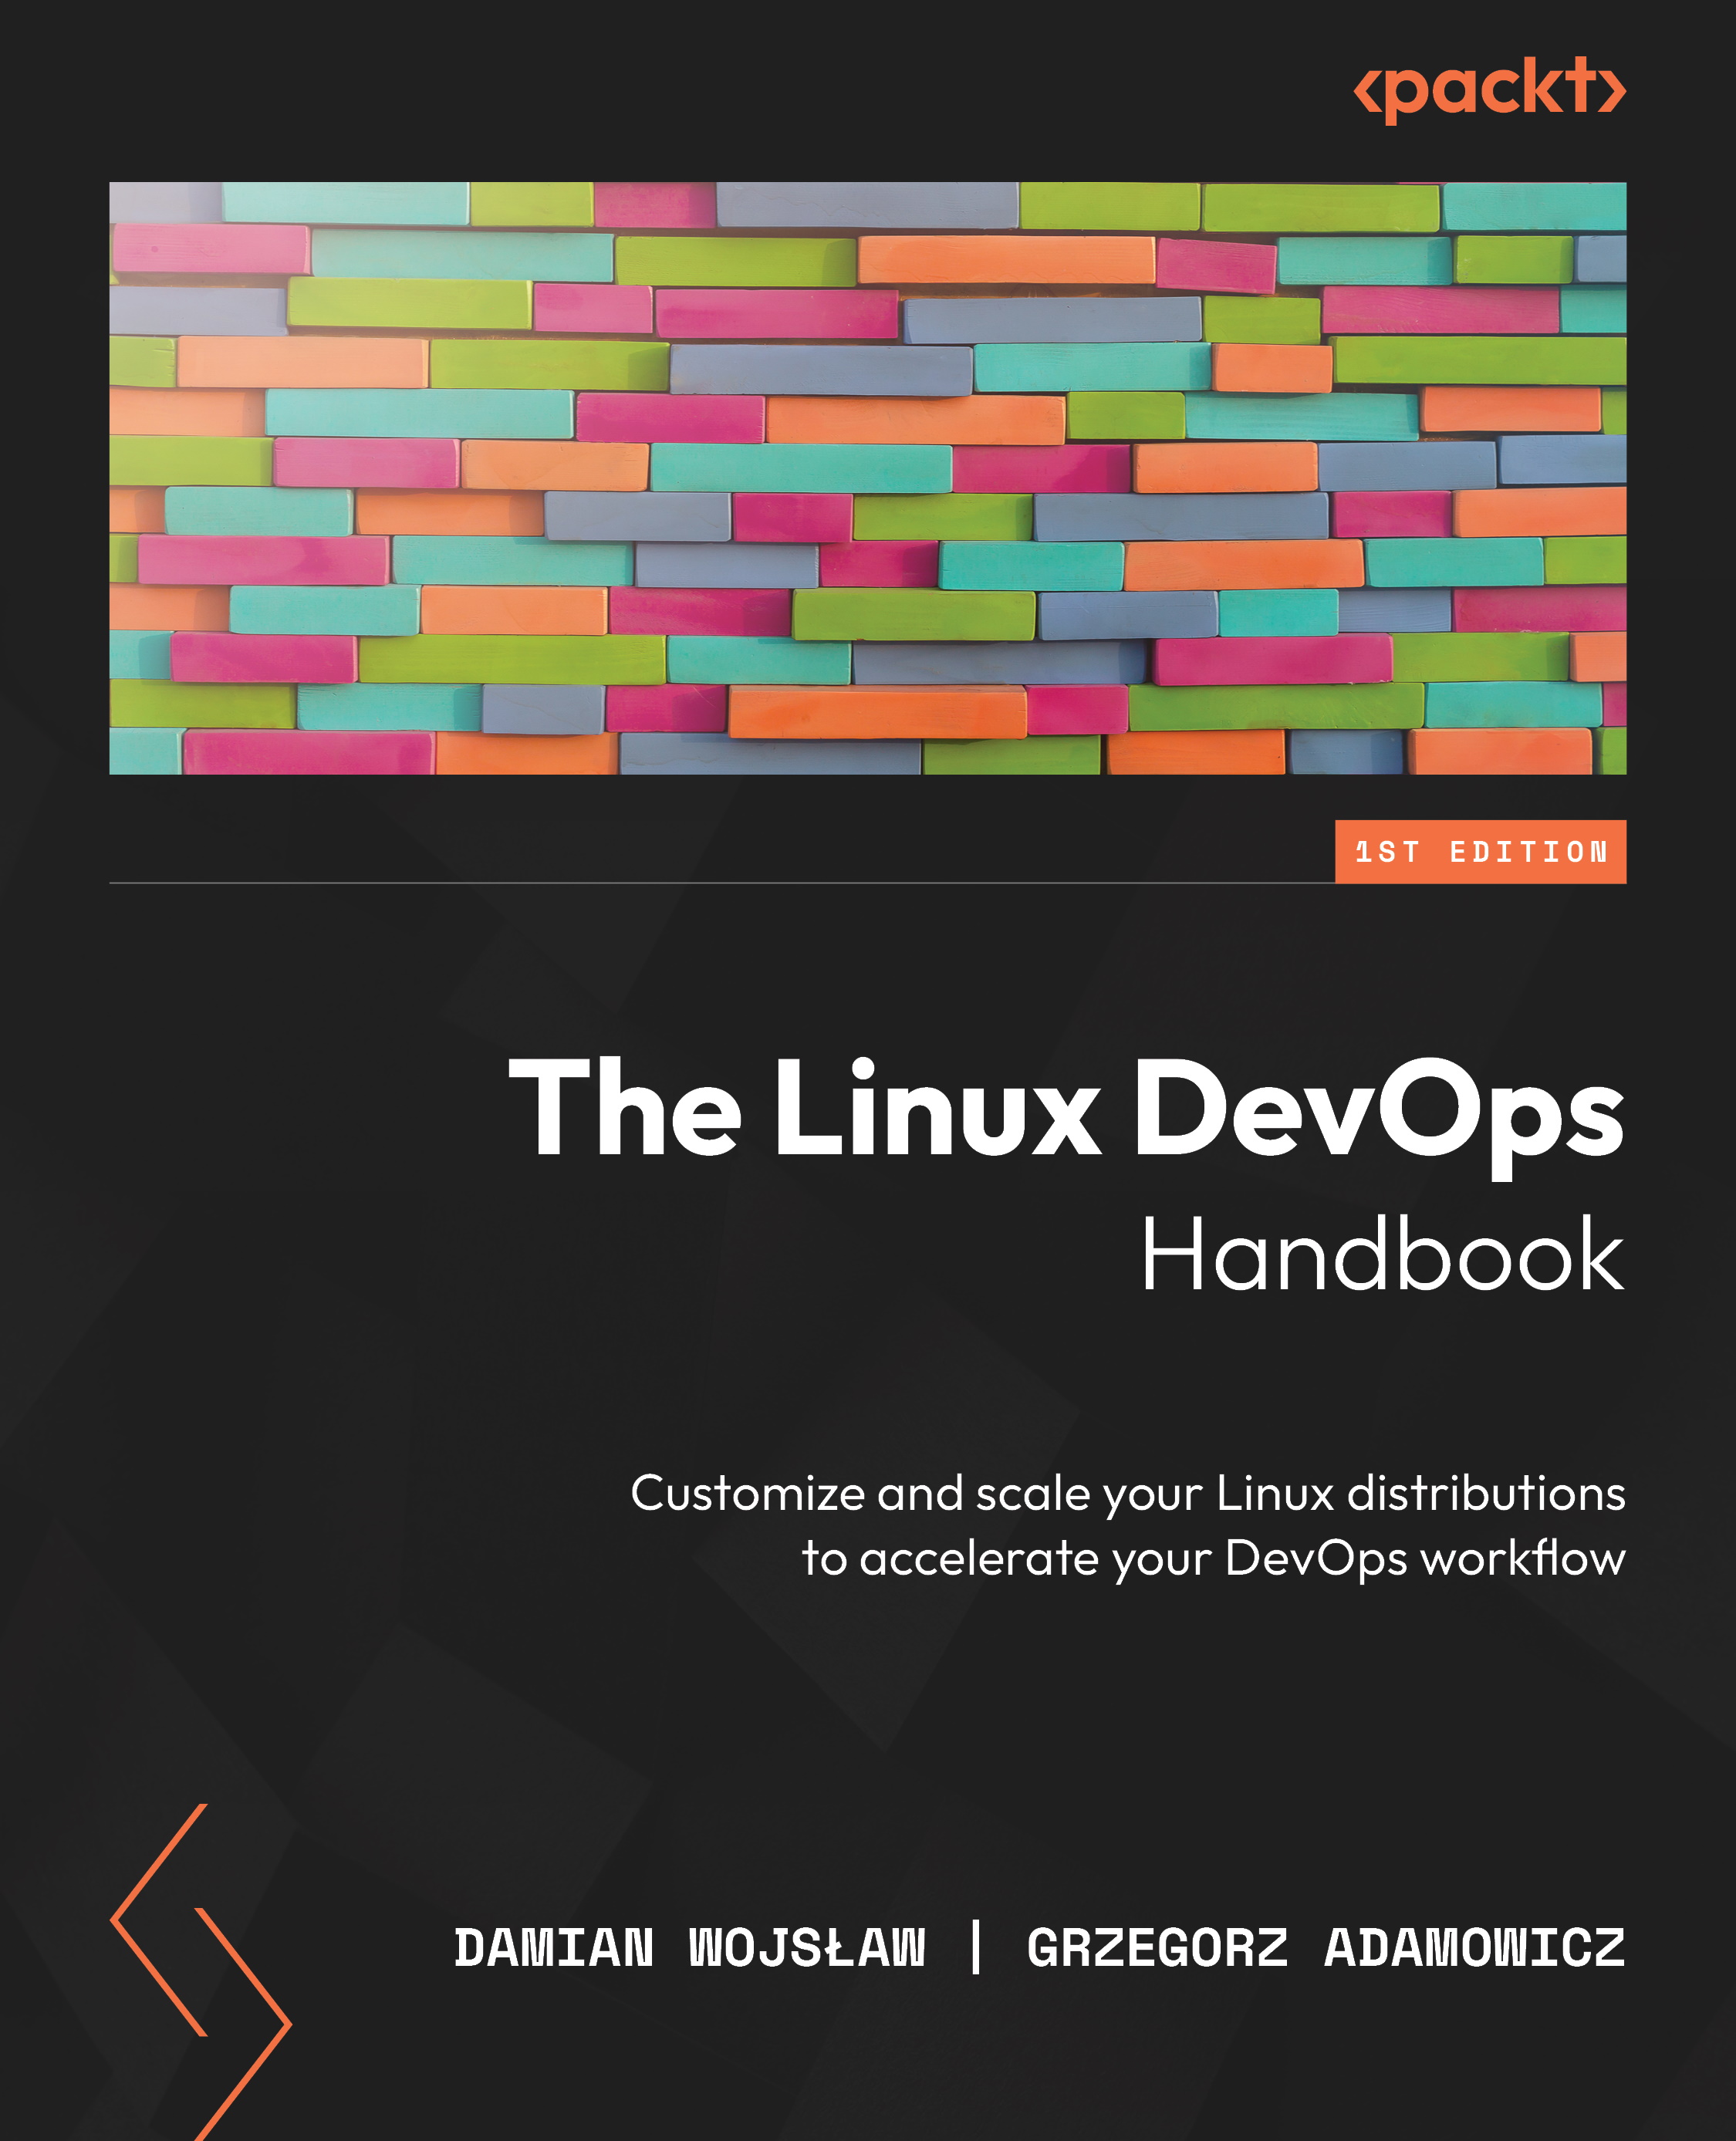
The Linux DevOps Handbook

You're reading from   The Linux DevOps Handbook Customize and scale your Linux distributions to accelerate your DevOps workflow

Arrow left icon
Product type Paperback
Published in Nov 2023
Publisher Packt
ISBN-13 9781803245669
Length 428 pages
Edition 1st Edition
Languages
Tools
Concepts
Arrow right icon
Authors (2):
Arrow left icon
Damian Wojsław Damian Wojsław
Author Profile Icon Damian Wojsław
Damian Wojsław
Grzegorz Adamowicz Grzegorz Adamowicz
Author Profile Icon Grzegorz Adamowicz
Grzegorz Adamowicz
Arrow right icon
View More author details
Toc

Table of Contents (20) Chapters Close

Preface 1. Part 1: Linux Basics
2. Chapter 1: Choosing the Right Linux Distribution FREE CHAPTER 3. Chapter 2: Command-Line Basics 4. Chapter 3: Intermediate Linux 5. Chapter 4: Automating with Shell Scripts 6. Part 2: Your Day-to-Day DevOps Tools
7. Chapter 5: Managing Services in Linux 8. Chapter 6: Networking in Linux 9. Chapter 7: Git, Your Doorway to DevOps 10. Chapter 8: Docker Basics 11. Chapter 9: A Deep Dive into Docker 12. Part 3: DevOps Cloud Toolkit
13. Chapter 10: Monitoring, Tracing, and Distributed Logging 14. Chapter 11: Using Ansible for Configuration as Code 15. Chapter 12: Leveraging Infrastructure as Code 16. Chapter 13: CI/CD with Terraform, GitHub, and Atlantis 17. Chapter 14: Avoiding Pitfalls in DevOps 18. Index 19. Other Books You May Enjoy

Summary

In this chapter, we covered the differences between monitoring, tracing, and logging. Monitoring is the process of observing and collecting data on a system to ensure it’s running correctly. Tracing is the process of tracking requests as they flow through a system to identify performance issues. Logging is the process of recording events and errors in a system for later analysis.

We also discussed cloud solutions for monitoring, logging, and tracing in Azure, GCP, and AWS. For Azure, we mentioned Azure Monitor for monitoring and Azure Application Insights for tracing. For AWS, we mentioned CloudWatch for monitoring and logging, and X-Ray for tracing.

We then went on to explain and provide an example of configuring the AWS CloudWatch agent on an EC2 instance. We also introduced AWS X-Ray with a code example to show how it can be used to trace requests in a distributed system.

Finally, we named some open source and SaaS solutions for monitoring, logging, and tracing...

lock icon The rest of the chapter is locked
Register for a free Packt account to unlock a world of extra content!
A free Packt account unlocks extra newsletters, articles, discounted offers, and much more. Start advancing your knowledge today.
Unlock this book and the full library FREE for 7 days
Get unlimited access to 7000+ expert-authored eBooks and videos courses covering every tech area you can think of
Renews at €18.99/month. Cancel anytime