Configuring live charts
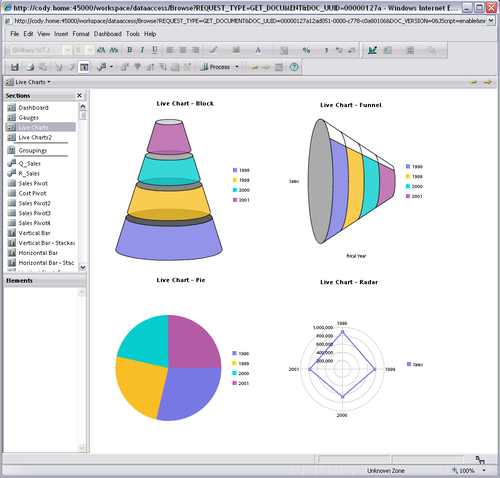
Configuring the live chart objects is similar to configuring gauges. When a live chart is added to a dashboard, the live chart must be populated with data from a Query section. Additionally, the properties of the live chart can be modified to produce the desired chart display of interest. The next two screenshots are examples of the six types of live charts available for use in the document. The following screenshot shows the Block, Pie, Funnel, and Radar live charts:

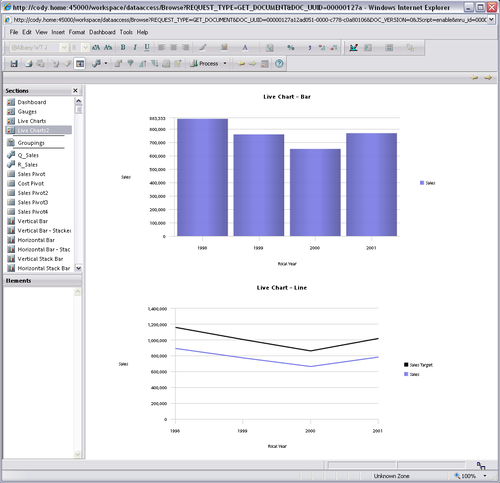
The following screenshot displays an example of a Bar and Line live chart:

When the dashboard is under design, clicking and highlighting the live chart will bring up the Data Layout window. Each live chart contains a Fact area and chart-specific non-fact areas for adding data elements. Dragging-and-dropping the desired elements from the Elements window into the Data Layout area will configure and populate the object with data. After adding the elements to the section, making the dashboard active will...


