Understanding and exploring the Query Execution Plan
Sometimes, we get questions from business users about queries or reports running slowly, and we struggle to understand the root cause and how to fix it. The Query Execution Plan is the answer to that question. Now, you must be wondering what the query execution plan is, right?
There are multiple steps that SQL Server takes to execute the query. The graphical representation of these steps is called the Query Execution Plan. It displays the details of each step, such as the number of actual rows, estimated rows, I/O and CPU cost, percentage of the cost of each step, and so on. Each step in the execution plan is called a node.
Are you wondering what a query execution plan looks like? Here is an example of a query execution plan for the SELECT TOP (1000) * FROM [WideWorldImporters].[Sales].[Customers];
query displaying the nodes of the execution plan:
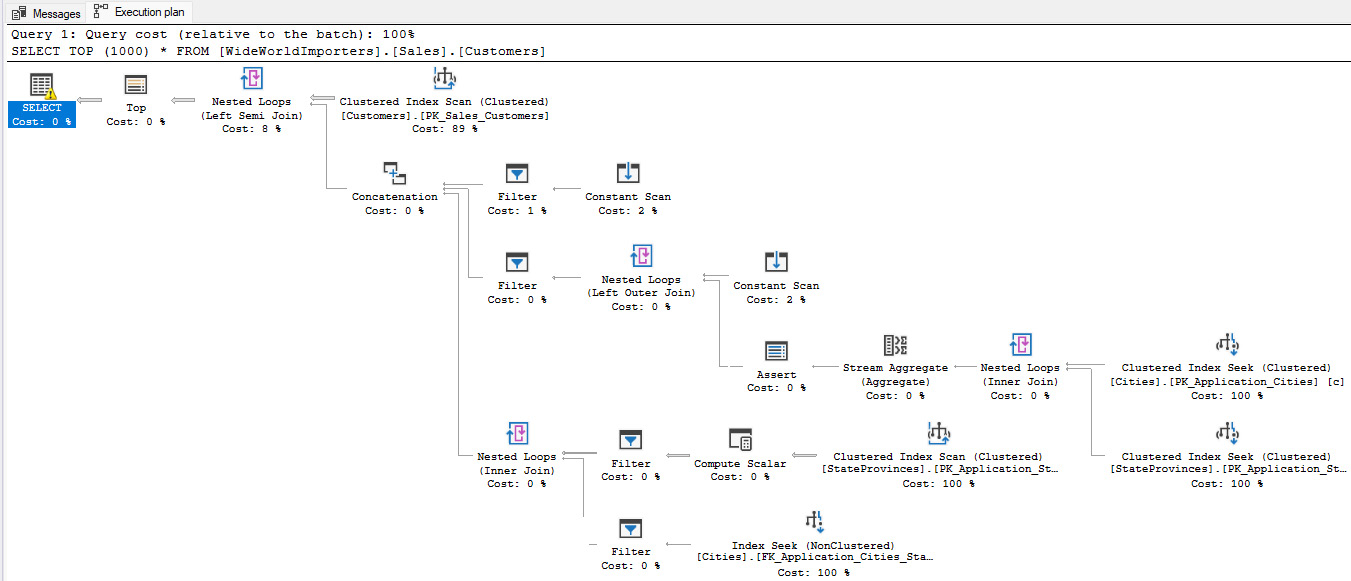
Figure 9.1 – A sample query execution plan
Let us look at this in more detail in the next section.
Query Plan types
There are three types of execution plans available in SQL Server: estimated execution plan, actual execution plan, and live query statistics. Let’s understand each of these with examples.
The estimated execution plan
These are compiled plans produced by the Query optimizer, based on the estimates that SQL Server would most probably use to execute the query. To display the estimated execution plan, open an existing SQL query or write a new query. Let’s take a simple query to see its execution plan:
SELECT TOP (1000) [CityID] ,[CityName] ,[StateProvinceID] ,[Location] ,[LatestRecordedPopulation] ,[LastEditedBy] FROM [WideWorldImporters].[Application].[Cities];
Use the Ctrl + L key combination or click on the Display Estimated Execution Plan button on the toolbar, as shown in the following screenshot:
Figure 9.2 – The Display Estimated Execution Plan option on the toolbar
Here is how an estimated execution plan looks for this query:
Figure 9.3 – The estimated execution plan of the query in the query pane
The Actual Execution Plan
The actual execution plan is generated after the query execution, and hence displays the actual information that the SQL Server database engine uses to execute the query. Here is how we do it:
To display the Actual Execution Plan for the same query, use the previous query, and use the Ctrl + M key combination or click on Include Actual Execution Plan, as shown in the figure here:
Figure 9.4 – The Include Actual Execution Plan option on the toolbar
Now, click on the Execute button or use the Alt + X key combination to execute the query, which will display an additional Execution plan tab in the result pane shown as follows:
Figure 9.5 – The result of the query after execution
Click on the Execution plan tab to view the Actual Execution Plan, which will look as follows:
Figure 9.6 – Displays the Actual Execution Plan of the query in query pane
Live Query Statistics
Live Query Statistics is a compiled execution plan that displays the live statistics of the query as the query is executing. The statistics keep changing every second during the query execution. This live query plan displays the query progress as the query steps are executing, and hence displays operator-level live execution statistics such as the number of rows, operator progress, elapsed time, and so on. As the data statistics are available in real time, we do not need to wait to finish the execution; we can find whether there is any issue on the node in real time and cancel the query to address the issue later. This option is only available starting from SQL Server 2016.
To display the live query statistics, perform the following steps:
- Click on the Include Live Query Statistics button on the toolbar, as shown in the following screenshot:
Figure 9.7 – The Include live query statistics option on the toolbar
- Now, click on the Execute button or use the Alt + X key combination to execute the query. You will notice an additional tab, Live Query Statistics, in the result pane, as shown in the preceding screenshot:
Figure 9.8 – The result of the query after query execution in the result pane
Live Query Statistics is also called the Live Execution Plan, and these names will be used interchangeably.
We have to save these query execution plans for investigation. For example, to compare two execution plans, we need to at least save one execution plan and then compare it with either another saved plan for the query or generate an execution plan for the same query using the methods we learned about earlier.
To save the execution plan in XML format, there are two methods: using SHOWPLAN_XML
while running the query in the query editor, or using the execution plan in a graphical interface.
To save a query plan using the XML showplan SET
option, try the following:
- Open SSMS and connect to the
WideWorldImporters
database. - Turn
SHOWPLAN_XML
on, as referenced here:SET SHOWPLAN_XML ON; GO
This command will then generate an estimated query plan in XML format. It contains the information generated during the compilation of the query, not the execution of the query, hence it does not execute the query itself.
- To get the actual execution plan in XML format, use the
STATISTICS XML
option, as referenced here:SET STATISTICS XML ON; GO
- This command will then generate the actual query plan in XML format. It contains the information during the execution of the query and executes the query.
Execute the referenced query here to get the estimated query plan:
SET SHOWPLAN_XML ON; GO SELECT TOP (1000) [CityID] ,[CityName] ,[StateProvinceID] ,[Location] ,[LatestRecordedPopulation] ,[LastEditedBy] FROM [WideWorldImporters].[Application].[Cities] ; GO SET SHOWPLAN_XML OFF; GO
Here is how the query is executed:
Figure 9.9 – The XML plan of the query in the query result pane
- In the Results pane, right-click the result and select the Save Results As… option, as referenced here:
Figure 9.10 – The Save Result ts As... option to save the XML query plan
Select the location where you want to save the query plan, name the query plan with the.sqlplan
extension, set the Save as type: option to All files (*.*), and click the Save button, as shown here:
Figure 9.11 – Displays where you can save the plan
To save a query plan using SSMS, perform the following steps:
- Generate the execution plan as per your requirements; we discussed how to generate all three types of the execution plan in this chapter.
- Right-click on the Execution plan tab of the Results pane as shown:
Figure 9.12 – The Save Execution Plan As... option
- Select the location where you want to save the query plan, name the query plan with the
.sqlplan
extension, set the Save as type: option to All files (*.*), and click on the Save button, as referenced here:
Figure 9.13 – How to save the query execution plan
To open the saved XML plan using SSMS, perform the following steps:
- Go to File | Open | File option, or use the Ctrl + O key combination to open the Open File dialog box.
- Navigate to the file location where you have saved the XML execution plan in the XML format.
- Select the desired file and click Open, as referenced here:
Figure 9.14 – How to open a saved execution plan
- You will see the execution plan as referenced here:
Figure 9.15 – The saved execution plan
As we now understand how to save execution plans, let's look at how to compare two executions to see which one is better.
Comparing execution plans
As we discussed in this chapter, an optimizer can store multiple plans for a query and uses the best possible plan. However, sometimes, we observe slowness in the query. This could be because the query optimizer has generated a new plan and used it instead of the old plan. We can compare the existing plan with the new plan to find the best one and force the SQL Server to use the plan of our choice.
To compare query execution plans, follow these steps:
- Open the query execution plan or drag and drop a plan file into SSMS, or you can execute the executing query and generate the estimated/actual execution plan.
- Right-click anywhere in Execution plan and select Analyze Actual Execution Plan, as shown here:
Figure 9.16 – How to get the Compare Showplan option to compare the execution plans
- Select and open the second query plan file that you want to compare with the newly generated execution plan or open the
Execution
plan
file. - The comparison of two query execution plans looks like the following:
Figure 9.17 – The comparison of two execution plans
- Look at the Properties window on the right side of the screen; you will notice the not equal sign highlighted, which lets you know the differences between the two query plans. Refer to the following screenshot:
Figure 9.18 – The Properties comparison of two execution plans
Notice the Showplan Analysis window at the bottom, which has three tabs:
- Statement Options: This tab shows the highlighted similar operations and the same highlighted operators or the nodes of two execution plans compared. You can browse through the similar compared plans or choose the highlighted differences in the plans instead of similarities, or both. Refer to the following screenshot:
Figure 9.19 – The options to get the similarities of two execution plans
- Multi Statement: This tab is used when we compare plans with multiple statements to allow the right statement pair to be compared, as shown here:
Figure 9.20 – The comparison of statements of both plans
- Scenarios: In this tab, we can find an automated analysis or relevant aspects to get cardinality estimation differences between two plans. You can see that, for each operator in the left window, the right window shows the details and the links you can refer to:
Figure 9.21 – The findings and details from the comparison of two execution plans
We discussed how we can compare two plans to identify which one is best. Besides comparing the two plans, we will analyze each plan to understand them in detail next.
Analyzing the query plan
To diagnose, optimize, and fine-tune a SQL query, we must have a deeper understanding of the query process and the execution plan. For that, SSMS is loaded with a functionality to analyze the query execution plan, especially for complex and large execution plans. It would help us to find the inaccurate cardinality estimation and get possible mitigation recommendations.
Here are the steps to analyze the execution plan:
- Open a saved XML execution plan or use the newly generated execution plan using SSMS.
- Right-click anywhere in Execution plan and select Analyze Actual Execution Plan, as shown here:
Figure 9.22 – How to get the Analyze Actual Execution Plan option
- Showplan Analysis displays the actual execution plan, the properties of execution plans, and the showplan analysis. The Showplan Analysis window contains two tabs: Multi Statement and Scenarios. Please refer to the following screenshot:
Figure 9.23 – The result of Showplan Analysis
And with this, we have learned about the Multi Statement and Scenarios tabs for comparing query plans.
So, now we can view, compare, and analyze actual execution plans, understand the properties of each node of an execution plan for deeper understanding, and troubleshoot the query performance issues of poor performing queries using query execution plans.
With all this new information, what do we get? How can we use this information to diagnose and improve the performance of our query?
Let’s understand it with the help of a simple example. Use the query and generate the actual execution plan to see whether the query’s performance can be improved by adding an index:
SELECT [CityName] FROM [WideWorldImporters]. [Application].[Cities] WHERE CityName='Abbeville'
The execution plan shows that the performance of the query can be improved by 99.0992% if we add the suggested index. Notice the highlighted text in the figure, which shows the index is being scanned to get the desired row:
Figure 9.24 – The actual execution plan using an clustered index scan and recommending an index
Right-click on the missing index statement in green and select Missing Index Details... as referenced here:
Figure 9.25 – Missing index details to get recommended index code
You will get the code referenced in the figure here:
Figure 9.26 – The index definition
Indexes are covered in details in Chapter 10. Let’s now give a meaningful name to the index and create it with the code shown here:
USE [WideWorldImporters] GO CREATE NONCLUSTERED INDEX [IX_ApplicationCitiesCityName] ON [Application].[Cities] ([CityName]) GO
Now, let’s rerun the query and generate the actual execution plan, as shown in this figure:
Figure 9.27 – The result of Showplan Analysis
Notice that, now, the new index is being used and it’s using Index Seek
instead of a clustered index scan. An index scan is an expensive operation with respect to Index Seek
. Hence the performance of the query will be improved after we create this query.
The index recommendation for query plans is not always good and proper testing must be performed before implementing it into the production environment.