Search icon CANCEL
Subscription
0
Cart icon
Your Cart (0 item)
Close icon
You have no products in your basket yet
Arrow left icon
Explore Products
Best Sellers
New Releases
Books
Videos
Audiobooks
Learning Hub
Free Learning
Arrow right icon
Arrow up icon
GO TO TOP
Mastering vRealize Operations Manager

You're reading from   Mastering vRealize Operations Manager Analyze and optimize your IT environment by gaining a practical understanding of vRealize Operations 6.6

Arrow left icon
Product type Paperback
Published in Mar 2018
Publisher
ISBN-13 9781788474870
Length 426 pages
Edition 2nd Edition
Arrow right icon
Authors (3):
Arrow left icon
Chris Slater Chris Slater
Author Profile Icon Chris Slater
Chris Slater
Spas Kaloferov Spas Kaloferov
Author Profile Icon Spas Kaloferov
Spas Kaloferov
Scott Norris Scott Norris
Author Profile Icon Scott Norris
Scott Norris
Arrow right icon
View More author details
Toc

Table of Contents (17) Chapters Close

Preface 1. Going Ahead with vRealize Operations FREE CHAPTER 2. Which vRealize Operations Deployment Model Fits Your Needs 3. Initial Setup and Configuration 4. Extending vRealize Operations with Management Packs and Plugins 5. Badges 6. Getting a Handle on Alerting and Notifications 7. Capacity Management Made Easy 8. Aligning vRealize Operations with Business Outcomes 9. Super Metrics Made Super Easy 10. Creating Custom Views 11. Creating Custom Dashboards 12. Using vRealize Operations to Monitor Applications 13. Leveraging vRealize Operations for vSphere and vRealize Automation Workload Placement 14. Using vRealize Operations for Infrastructure Compliance 15. Troubleshooting vRealize Operations 16. Other Books You May Enjoy

vRealize Operations key component architecture

In vRealize Operations 6.0, a new platform design was introduced to meet some of the required goals that VMware envisaged for the product. These included the following:

  • The ability to treat all solutions equally, and to be able to offer management of performance, capacity, configuration, and compliance to both VMware and third-party solutions
  • Provide a single platform that can scale to tens of thousands of objects and millions of metrics by scaling out with little reconfiguration or redesign required
  • Support a monitoring solution that can be highly available, and support the loss of a node without impacting the ability to store or query information

With that new common platform, the design came a completely new architecture.

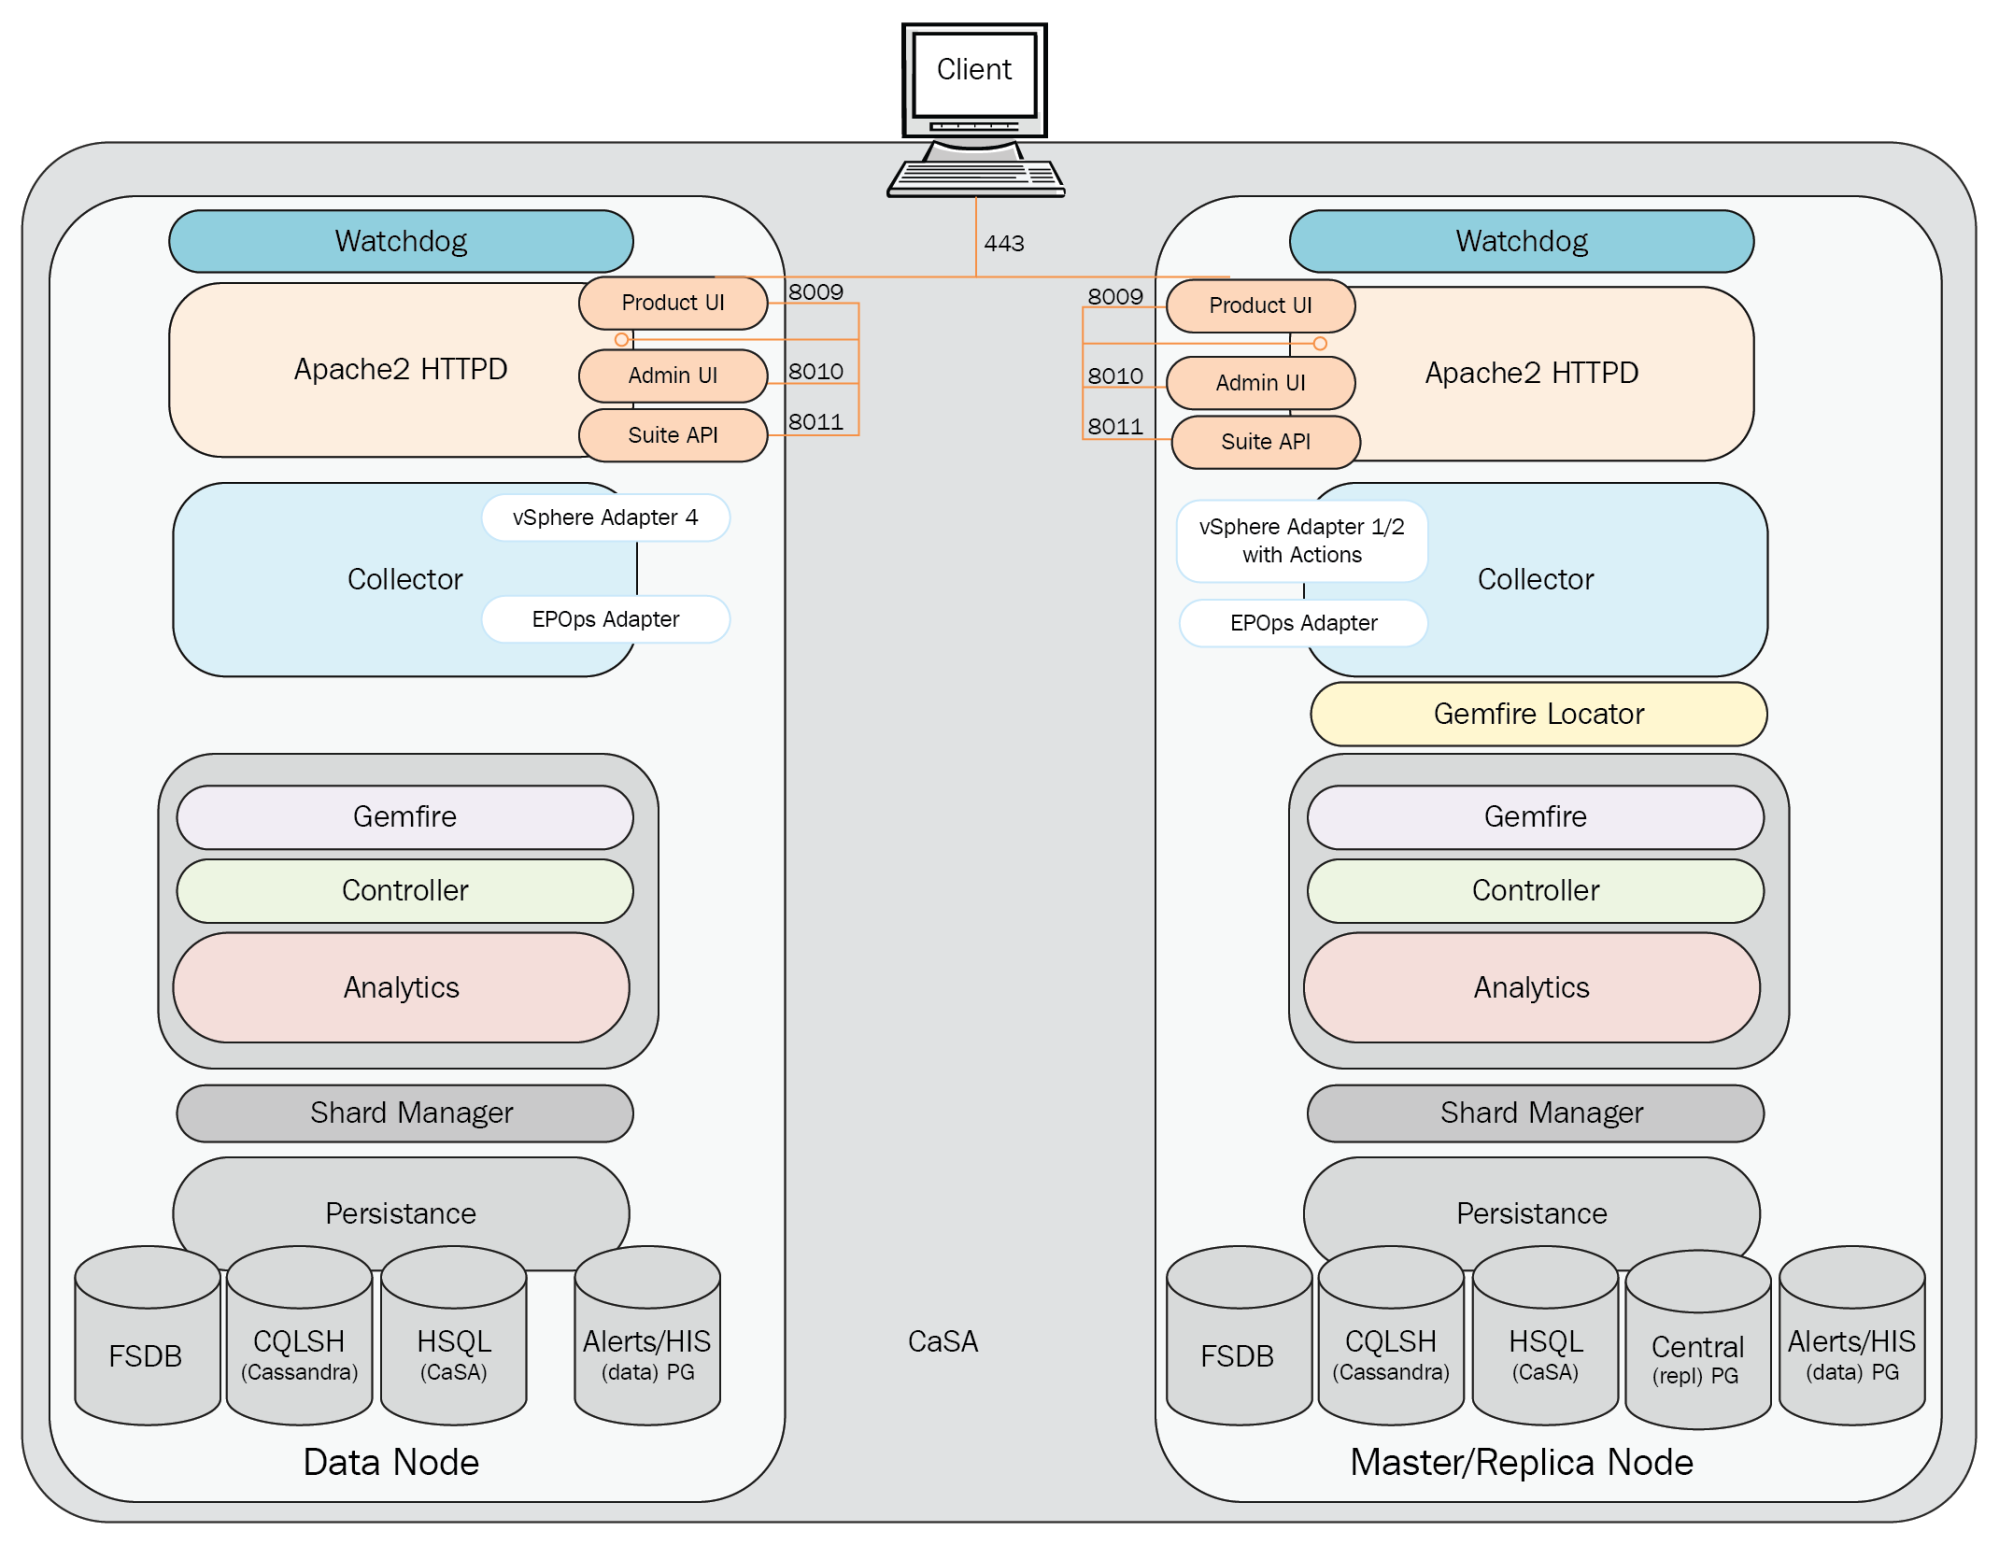
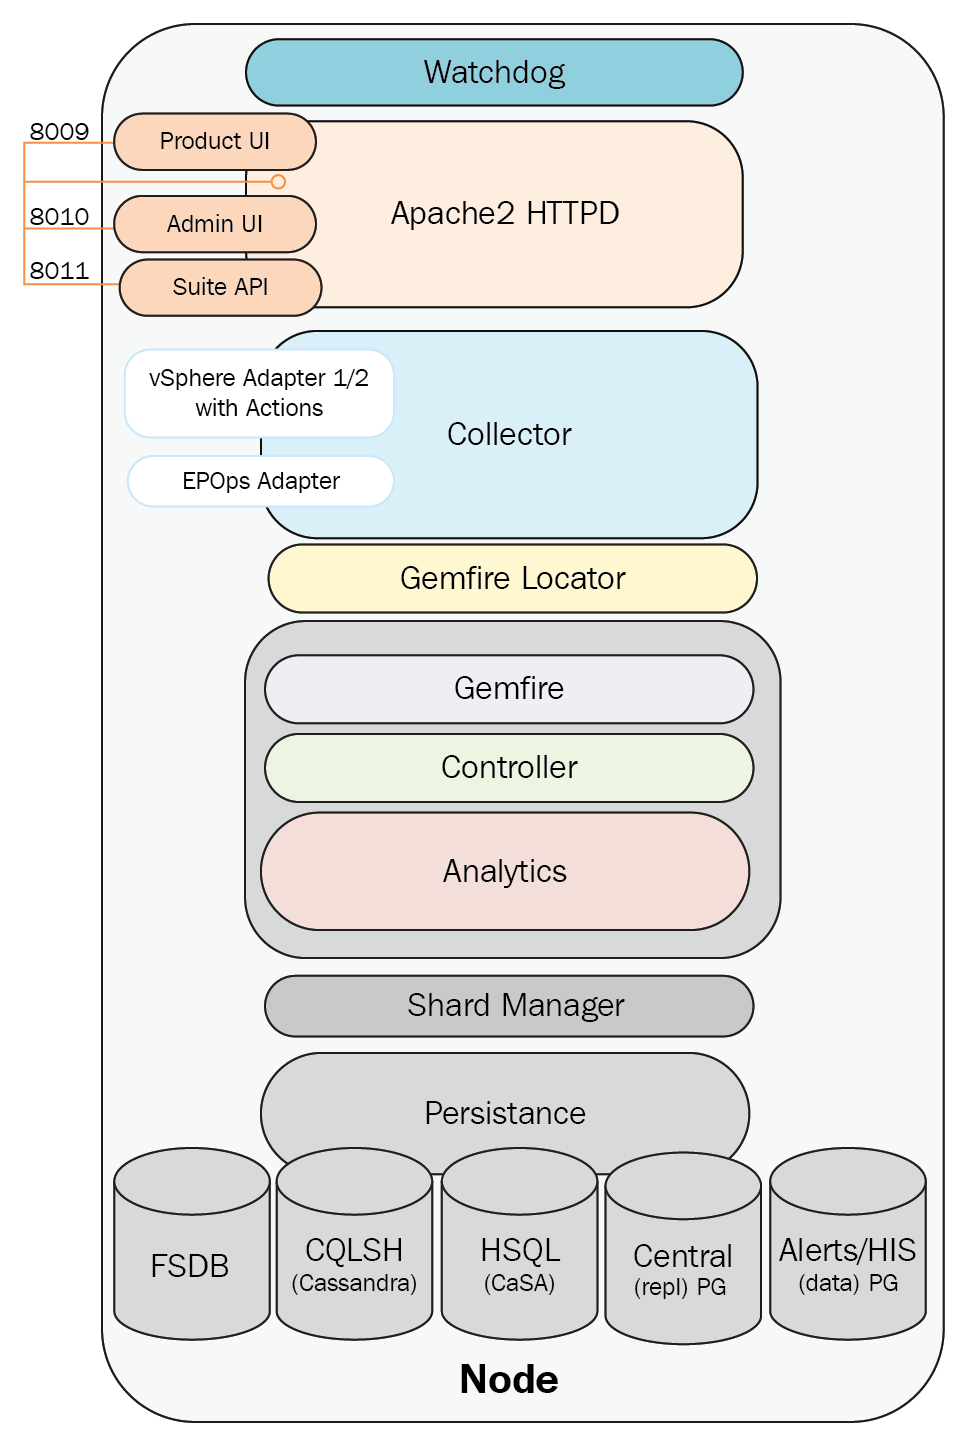
The following diagram shows the major components of the vRealize Operations 6.6 architecture:

The components of the vRealize Operations 6.6 architecture are as follows:

  • Watchdog
  • The user interface
  • Collector
  • GemFire
  • GemFire Locator
  • Controller
  • Analytics
  • Persistence

The Watchdog service

Watchdog is a vRealize Operations service that maintains the necessary daemons/services and attempts to restart them as necessary should there be a failure. The vcops-watchdog is a Python script that runs every five minutes by means of the cops-watchdog-daemon with the purpose of monitoring the various vRealize Operations services, including the Cluster and Slice Administrator (CaSA).

The Watchdog service performs the following checks:

  • PID file of the service
  • Service status

The user interface

In vRealize Operations 6.6, the UI is broken into two components the Product UI, and the Admin UI. The Product UI is present on all nodes, with the exception of nodes that are deployed as remote collectors.

The Admin UI is a web application hosted by Pivotal tc Server (Java application Apache web server), and is responsible for making HTTP REST calls to the admin API for node administration tasks. The CaSA is responsible for cluster administrative actions, such as the following:

  • Enabling/disabling the vRealize Operations cluster
  • Enabling/disabling cluster nodes
  • Performing software updates
  • Browsing log files

The Admin UI is purposely designed to be separate from the Product UI and to always be available for administration and troubleshooting-type tasks. A small database caches data from the Product UI that provides the last known state information to the Admin UI in the event that the Product UI and analytics are unavailable.

The Admin UI is available on each node at https://<NodeIP>/admin.

The Product UI is the main vRealize Operations graphical user interface. Like the Admin UI, the Product UI is based on Pivotal tc Server, and can make HTTP REST calls to the CaSA for administrative tasks; however, the primary purpose of the Product UI is to make GemFire calls to the Controller API to access data and create views, such as dashboards and reports.

The Apache2 HTTPD also provides the backend platform for another Tomcat instances. The Suite API is a public-facing API that can be used for automating/scripting common tasks. It is also used internally by vRealize Operations for carrying out numerous administrative tasks. The End Point Operations Management Adapter, HTTP Post Adapter, and Telemetry are also run by this Tomcat instance.

As shown in the following diagram, the Product UI is simply accessed via HTTPS on TCP 443. Apache then provides a reverse proxy back to the Product UI running in tc Server using the Apache APJ protocol:

The Collector

The Collector process is responsible for pulling in inventory and metric data from the configured sources. As shown in the following diagram, the Collector uses adapters to collect data from various sources, and then contacts the GemFire locator for connection information to one or more Controller cache servers. The Collector service then connects to one or more Controller API GemFire cache servers, and sends the collected data.

It is important to note that although an instance of an adapter can only be running on one node at a time, it does not imply that the collected data is being sent to the Controller on that node.

The Collector will send a heartbeat to the Controller every 30 seconds. This is sent via the HeartbeatThread thread process running on the Collector. It has a maximum of 25 data collection threads. Vice versa, the Controller node, vice versa, runs a HeartbeatServer thread process which processes heartbeats from Collectors. The CollectorStatusChecker thread process is a DistributedTask which uses data from HeartbeatServers to decides whether the Collector is up or down.

By default, the Collector will wait for 30 minutes for adapters to synchronize.

The Collector properties, including enabling or disabling the self-protection, can be configured from the collector.properties properties file located in /usr/lib/vmware-vcops/user/conf/collector.

The vSphere adapter provides the Collector process with the configuration information needed to pull in vCenter inventory and metric data. It consists of configuration files and a JAR file. A separate adapter instance is configured for each vCenter Server.

The Python adapter provides the Collector process with the configuration information needed to send remediation commands back to a vCenter Server (power on/off VM, vMotion VM, reconfigure VM, and so on).

The End Point Operations Management adapter is installed and listening by default on each vRealize Operations node. To receive data from operating systems, the agent must be installed and configured on each guest OS to be monitored.

The Horizon adapter provides the Collector process with the configuration information needed to pull in the Horizon View inventory and metric data. A separate adapter instance is configured for each Horizon View pod, and only one adapter instance is supported per vRealize Operations node with a limit of 10,000 Horizon objects:
The GemFire

VMware vFabric® GemFire® is an in-memory, low-latency data grid, running in the same JVM as the Controller and Analytics, that scales as needed when nodes are added to the cluster. It allows the caching, processing, and retrieval of metrics, and is functionally dependent on the GemFire Locator.

Remote collector nodes only communicate over GemFire using ports 10000-10010.

The GemFire locator

The vFabric GemFire locator runs on the master and master replica nodes. The data nodes and remote Collectors run GemFire as a client process.

The Controller

The Controller is a sub-process of the Analytics process, and is responsible for coordinating activity between the cluster members. It manages the storage and retrieval of the inventory of objects within the system. The queries are performed leveraging the GemFire MapReduce function that allows for selective querying. This allows for efficient data querying, as data queries are only performed on select nodes rather than all nodes.

The Controller will monitor the Collector status every minute. It also monitors how long a deleted resource is available in the inventory, and how long a non-existing resource is stored in the database.

The Collector properties can be configured from the controller.properties properties file located in /usr/lib/vmware-vcops/user/conf/controller.

Analytics

Analytics is the heart of vRealize Operations, as it is essentially the runtime layer for data analysis. The role of the Analytics process is to track the individual states of every metric, and then use various forms of correlation to determine if there are problems.

At a high level, the Analytics layer is responsible for the following tasks:

  • Metric calculations
  • Dynamic thresholds
  • Alerts and alarms
  • Metric storage and retrieval from the Persistence layer
  • Root cause analysis
  • Historic Inventory Server (HIS) version metadata calculations and relationship data

Analytics components work with the new GemFire-based cache, Controller, and Persistence layers. The Analytics process is also responsible for generating SMTP and SNMP alerts on the master and master-replica nodes.

Persistence

The Persistence (the database) layer, as its name implies, is the layer where the data is persisted to disk. The layer primarily consists of a series of databases performing different functions, and having different roles.

vRealize Operations uses two data storage solutions:

  • Postgres: This is a relational database that stores the configuration and state of the data
  • FSDB: This is a proprietary high-performance filesystem-based repository that stores all the time series data

Understanding the Persistence layer is an important aspect of vRealize Operations, as this layer has a strong relationship with the data and service availability of the solution.

vRealize Operations has five primary database services, as follows:

Common name

Role

DB type

Sharded

Location

Cassandra DB

User preferences and configuration, alerts definition, customizations, dashboards, policies, view, reports, licensing, shard maps, activities

Apache Cassandra

No


/storage/db/vcops/cassandra

Central (

Repl

) DB

Resource inventory

PostgreSQL

Yes

/storage/db/vcops/vpostgres/data/

Alerts /HIS (Data) DB

Alerts and alarm history, history of resource property data, history of resource relationship

PostgreSQL

Yes

/storage/db/vcops/vpostgres/data/

FSDB

Filesystem database containing the following:

•RAW metrics

•Super metrics data

FSDB

Yes

/storage/db/vcops/data

/storage/db/vcops/rollup

CaSA DB

Cluster and Slice Administrator data

HSQL (Hyper SQL Database)

No

/storage/db/casa/webapp/

hsqlbd

Prior to 6.3, a common administrator task was to re-index the database. The 6.3 release, and later releases, contain a scheduled task to re-index the database. The script itself is available at the following location: /usr/lib/vmware-vcops/user/conf/persistence/vpostgres/vpostgres_sharded_db_index_rebuild.sh.

Sharding is the term that GemFire uses to describe the process of distributing data across multiple systems to ensure that compute, storage, and network load is evenly distributed across the cluster.

Cassandra DB

The Cassandra database was introduced in 6.1 to replace the Global xDB database. Apache Cassandra is a highly scalable, high-performance, distributed database. It is designed to handle large amounts of structured data across many nodes. It provides HA with no single point of failure. Cassandra is highly scalable, as it allows us to add more vRealize Operations nodes in the future to the existing cluster.

Currently, the database stores the following:

  • User preferences and configuration
  • Alerts definition
  • Customizations
  • Dashboards, policies, views
  • Reports, licensing
  • Shard maps
  • Activities

Cassandra stores all the info that we see in the CONTENT folder; basically any settings that are applied globally.

Central (repl) DB

The Postgres database was introduced in 6.1. It has two instances in version 6.6. The Central Postgres DB, also called repl and the Alerts/HIS Postgres DB, also called data, are two separate database instances under the database called vcopsdb.

The Central DB exists only on the master and the master-replica node when HA is enabled. It is accessible via port 5433 and it is located in /storage/db/vcops/vpostgres/repl.

Currently, the database stores only resource inventory information.

Alerts /HIS (Data) DB

The Alerts DB is called data on all the data nodes including Master and Master-replica node. It was again introduced in 6.1. Starting from 6.2, the Historical Inventory Service xDB was merged with the Alerts DB. It is accessible via port 5432, and it is located in /storage/db/vcops/vpostgres/data.

Currently, the database stores the following:

  • Alerts and alarm history
  • History of resource property data
  • History of resource relationship

HSQL DB

The HSQL (or CaSA) database is a small, flat, JSON-based, in-memory DB that is used by CaSA for cluster administration.

FSDB

The FSDB contains all raw time series metrics and super metrics data for the discovered resources. It stores the data collected by adapters, and data that is calculated/generated (such as a system, badge, and metrics) based on the analysis of that data.

FSDB is a GemFire server, and runs inside the analytics JVM. It uses Sharding Manager to distribute data between nodes (new objects). We will discuss what vRealize Operations cluster nodes are later in this chapter. The FSDB is available in all the nodes of a vRealize Operations cluster deployment.

You have been reading a chapter from
Mastering vRealize Operations Manager - Second Edition
Published in: Mar 2018
Publisher:
ISBN-13: 9781788474870
Register for a free Packt account to unlock a world of extra content!
A free Packt account unlocks extra newsletters, articles, discounted offers, and much more. Start advancing your knowledge today.
Unlock this book and the full library FREE for 7 days
Get unlimited access to 7000+ expert-authored eBooks and videos courses covering every tech area you can think of
Renews at $19.99/month. Cancel anytime
Banner background image