Plotting with polar coordinates
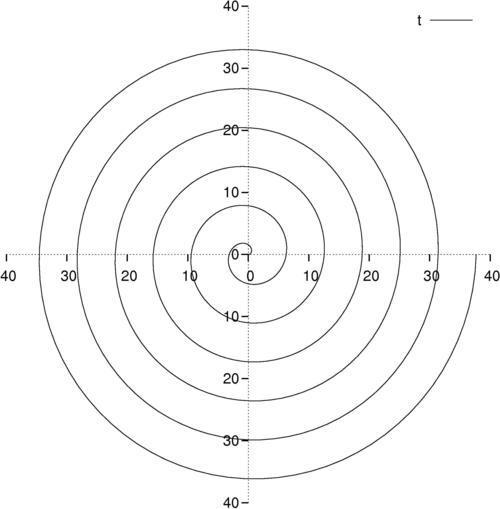
All the plots in this chapter up to now have implicitly used rectangular coordinates, usually denoted as x and y. For certain types of information, however, polar geometry is the natural coordinate system. In polar coordinates we have a radius, r, measured from the origin, usually at the center of the graph, and an angle, θ, usually measured counter-clockwise from the horizontal. On the gnuplot command line, the angular coordinate is called t by default. The following is an example of a spiral illustration:

Using polar coordinates we can plot spirals and closed curves that are impossible to define explicitly using rectangular coordinates.
How to do it…
Following is an example of how to use polar coordinates to get the spiral shown in the previous illustration:
set xtics axis nomirror
set ytics axis nomirror
set zeroaxis
unset border
set samples 500
set polar
plot [0:12*pi] t
How it works…
The first three lines create a pair of axes that intersect at the origin in the center of the graph. This works for polar plots too, where we are measuring the radius from the center. The unset border line removes the frame that has served up to now as axes for our rectangular coordinate plots. Next, we increase the number of samples for a smooth plot. The crucial, highlighted line set polar changes to polar (r-θ) coordinates from the default rectangular (x-y). In the plot command, t is now a dummy variable that passes through the given angular range (default [0:2*pi], changed to [0:12*pi] here), and the provided function (r) is a function of t, in this case the identity, that yields a circular spiral.


