Search icon CANCEL
Subscription
0
Cart icon
Your Cart (0 item)
Close icon
You have no products in your basket yet
Save more on your purchases! discount-offer-chevron-icon
Savings automatically calculated. No voucher code required.
Arrow left icon
Explore Products
Best Sellers
New Releases
Books
Videos
Audiobooks
Learning Hub
Newsletter Hub
Free Learning
Arrow right icon
timer SALE ENDS IN
0 Days
:
00 Hours
:
00 Minutes
:
00 Seconds
Arrow up icon
GO TO TOP
Software Development on the SAP HANA Platform

You're reading from   Software Development on the SAP HANA Platform Written by a SAP HANA expert, this book takes you from installation to running your own processes in no time. By the end of the course you'll have awesome data retrieval and analytical powers to call on.

Arrow left icon
Product type Paperback
Published in Jul 2013
Publisher
ISBN-13 9781849689403
Length 328 pages
Edition Edition
Arrow right icon
Author (1):
Arrow left icon
Mark Walker Mark Walker
Author Profile Icon Mark Walker
Mark Walker
Arrow right icon
View More author details
Toc

Table of Contents (19) Chapters Close

Software Development on the SAP HANA Platform
Credits
About the Author
About the Reviewers
www.PacktPub.com
Preface
1. So, What Is This SAP HANA Thing Anyways? FREE CHAPTER 2. SAP HANA Studio – Installation and First Look 3. Your First SAP HANA Development – An Attribute View 4. Painting with Numbers – An Analytic View 5. Let's Get Graphical – Graphical Calculation Views 6. You Talking to Me? – Scripted Calculation Views 7. Hey! That's My Data! – Authorizations in SAP HANA 8. On Another Level – Hierarchies in SAP HANA 9. Deploying Your Reporting Application to Reporting Software 10. Data Provisioning Using Data Services 11. Application Development Using the XS Engine So Long and Thanks – Where To Go from Here Index

Creating an analytic view


Let's start by creating a simple analytic view, so we can see how it works. Like an attribute view, we first need to identify the table which contains the information we are to work with. In our example data, we have a REVENUE table which contains CUSTID, YEAR, CURRENCY, and AMOUNT. As the column names suggest, this data represents the revenue, per customer, per year. Each AMOUNT is shown in a given CURRENCY, as we can see in the following screenshot:
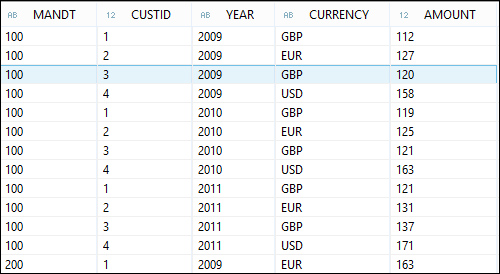
Once again, data exists from two clients, 100 and 200, so we'll need to filter on one of them to get something meaningful.

To create an analytic view, open the Quick Launch panel and navigate to Analytic View | Create.

Tip

If you can't find the Quick Launch panel, then you might not have the Studio's Modeler perspective open. If this is the case, navigate to Window | Open Perspective | Modeler, or navigate to Window | Open Perspective | Other | Modeler. This will open the panels you last opened when you did modeling tasks...

lock icon The rest of the chapter is locked
Register for a free Packt account to unlock a world of extra content!
A free Packt account unlocks extra newsletters, articles, discounted offers, and much more. Start advancing your knowledge today.
Unlock this book and the full library FREE for 7 days
Get unlimited access to 7000+ expert-authored eBooks and videos courses covering every tech area you can think of
Renews at $19.99/month. Cancel anytime
Banner background image