Now that all of the preliminary things are out of the way, we will code our first extremely simple predictive model. There will be two scripts written to accomplish this.
Our first R script is not a predictive model (yet), but it is a preliminary program which will view and plot some data. The dataset we will use is already built into the R package system, and is not necessary to load externally. For quickly illustrating techniques, I will sometimes use sample data contained within specific R packages themselves in order to demonstrate ideas, rather than pulling data in from an external file.
In this case our data will be pulled from the datasets package, which is loaded by default at startup.
- Paste the following code into the Untitled1 scripts that was just created. Dont worry about what each line means yet. I will cover the specific lines after the code is executed:
        require(graphics)
        data(women)
        head(women)
        View(women)
        plot(women$height,women$weight)
- Within the code pane, you will see a menu bar right beneath the Untitled1 tab. It should look something like this:
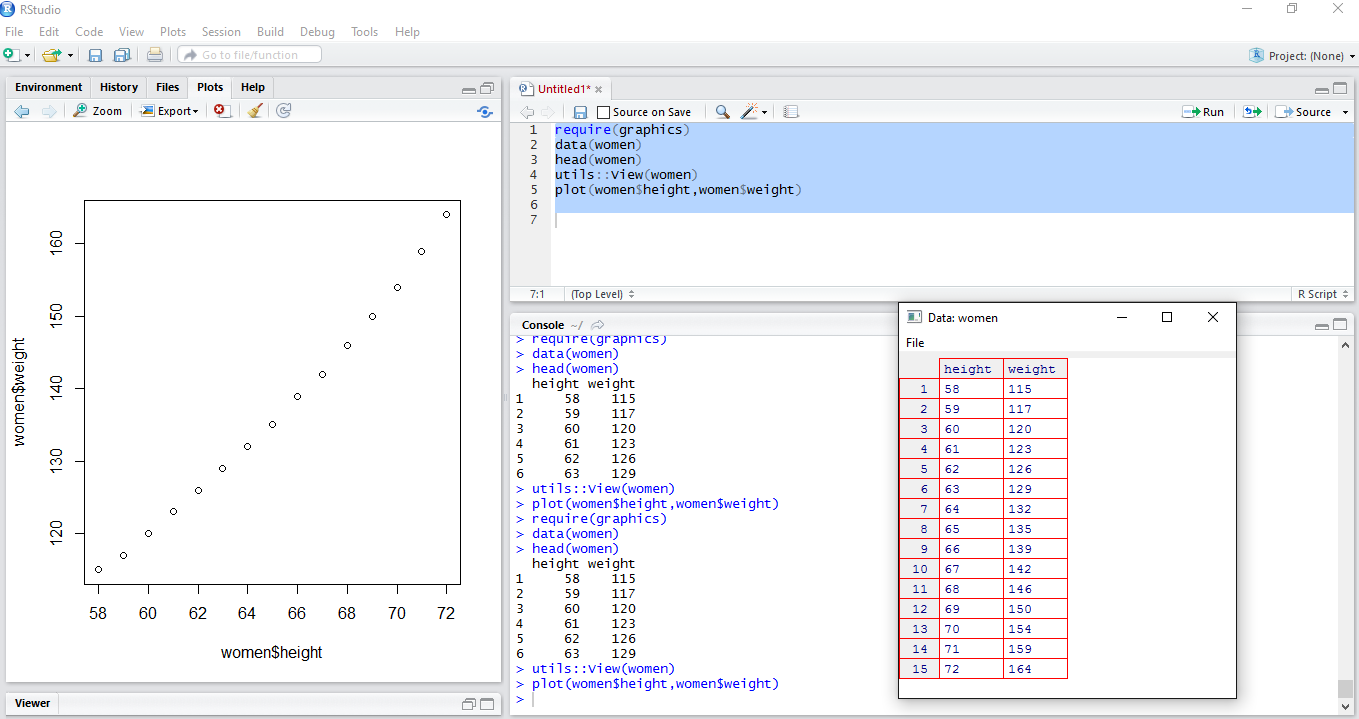
- To execute the code, Click the Source icon. The display should then change to the following diagram:

Notice from the preceding picture that three things have changed:
- Output has been written to the Console pane.
- The View pane has popped up which contains a two column table.
- Additionally, a plot will appear in the Plot pane.


