Working with coordinates
When we want TikZ to place a line, a circle, or any other element on the drawing, we need to tell it where to put it. For this, we use coordinates.
Now, you may remember elementary geometry from school or have looked at a good geometry book. In our case, we will use our knowledge of geometry mainly to position elements in our drawings.
Let’s start with classic geometry and how to use it with TikZ.
Cartesian coordinates
You may remember the Cartesian coordinate system you learned in school. Let’s quickly recap it. In the two dimensions of our drawing, we consider an x axis in the horizontal direction going from left to right and a y axis in the vertical order going from bottom to top. Then, we define a point by its distance to each axis. Let’s look at it in a diagram:
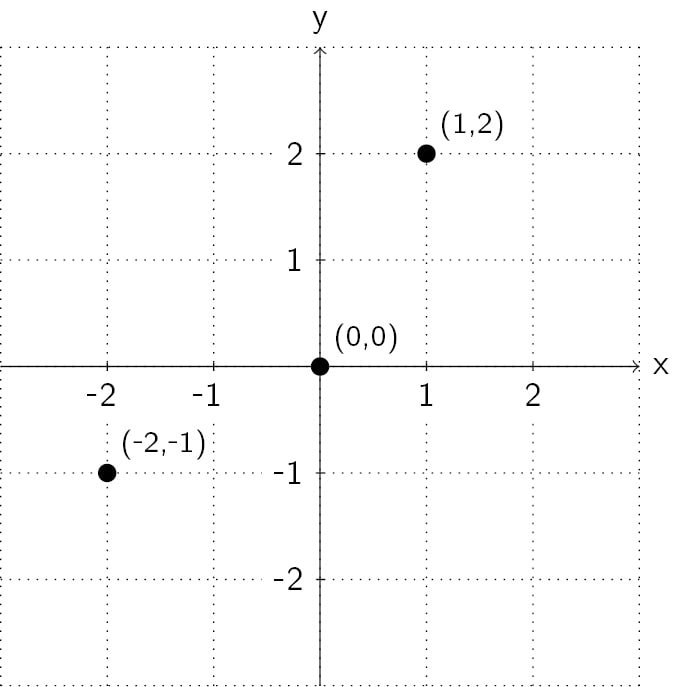
Figure 2.2 – Cartesian coordinate system
In Figure 2.2, we see a point (0,0) that we call the origin. It has a distance of zero to each axis. Then there’s the point, (1,2), that has a distance to the origin in a positive x direction of 1 and a positive y direction of 2. Similarly, for the (-2,1) point, we have an x value of -2, since it goes in the negative direction, and a y value of -1 for the same reason.
Labels at the x axis and y axis and a grid help us to see the dimensions. We will reuse the grid from Figure 2.1 when we next draw lines.
Remember, we draw elements between coordinates, and -- is the code for a line. So, the following command draws a line between the (2,-2) and (2,2) coordinates:
\draw (2,-2) -- (2,2);
We can add more coordinates and lines to this command – let’s make it a square. And to better see it over the grid, let’s make it have very thick blue lines:
\draw[very thick, blue] (-2,-2) -- (-2,2)
  -- (2,2) -- (2,-2) -- cycle;
Here, cycle closes the path, so the last line returns to the first coordinate.
The full context – that is, the complete LaTeX document with the cycle command – is highlighted in the code for Figure 2.1:
\documentclass[tikz,border=10pt]{standalone}
\begin{document}
\begin{tikzpicture}
  \draw[thin,dotted] (-3,-3) grid (3,3);
  \draw[->] (-3,0) -- (3,0);
  \draw[->] (0,-3) -- (0,3);
  \draw[very thick, blue] (-2,-2) -- (-2,2)
    -- (2,2) -- (2,-2) -- cycle;
\end{tikzpicture}
\end{document}
When you compile this document, you get this picture:
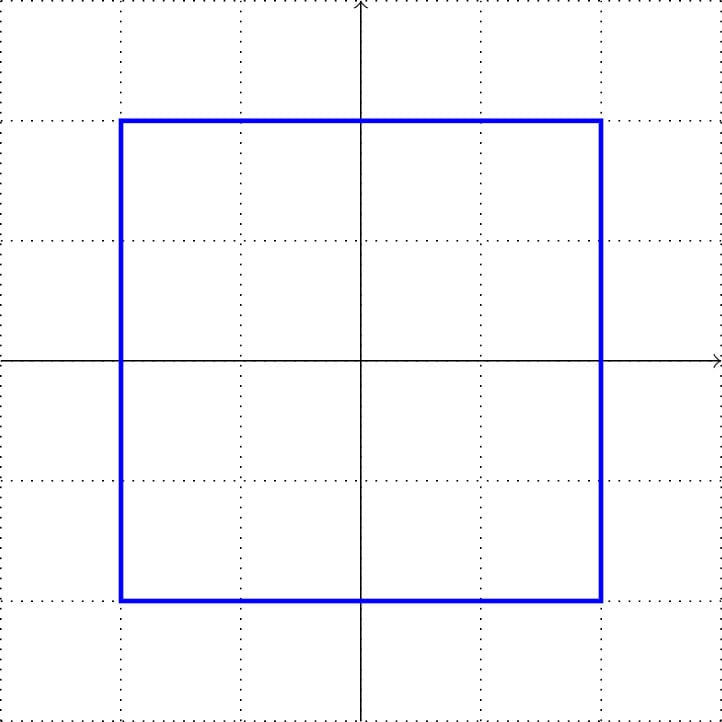
Figure 2.3 – A square in Cartesian coordinates
We used the \draw command to put lines at and between coordinates. How about something else? In TikZ, we can draw a circle with a certain radius as an element, with that radius as an argument in parentheses, such as circle (1) with a radius of 1. Let’s replace the -- lines with that and remove the now unnecessary cycle, and the command now looks like this:
\draw[very thick, blue] (-2,-2) circle (1) (-2,2)
  circle (1) (2,2) circle (1) (2,-2) circle (1);
Compile, and you get this in the PDF document:
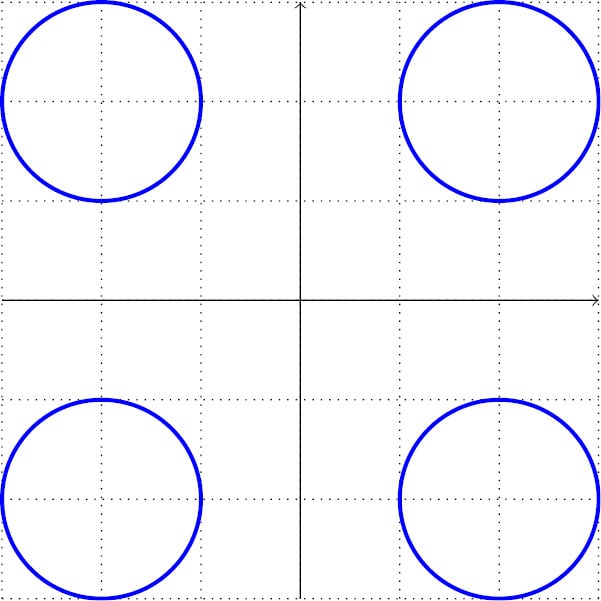
Figure 2.4 – Circles in Cartesian coordinates
This example emphasizes how we use the \draw command – as a sequence of coordinates with picture elements at those coordinates. As you saw, we can draw several elements in a single \draw command.
With Cartesian coordinates, it was easy to draw a square. But how about a pentagon? Or a hexagon? Calculating corner coordinates looks challenging. Here, angle- and distance-based coordinates can be more suitable; let’s look at this next.
Polar coordinates
Let’s consider the same plane as we had in the last section. Just now, we define a point by its distance to the origin and the angle to the x axis. Again, it’s easier to see it in a diagram:
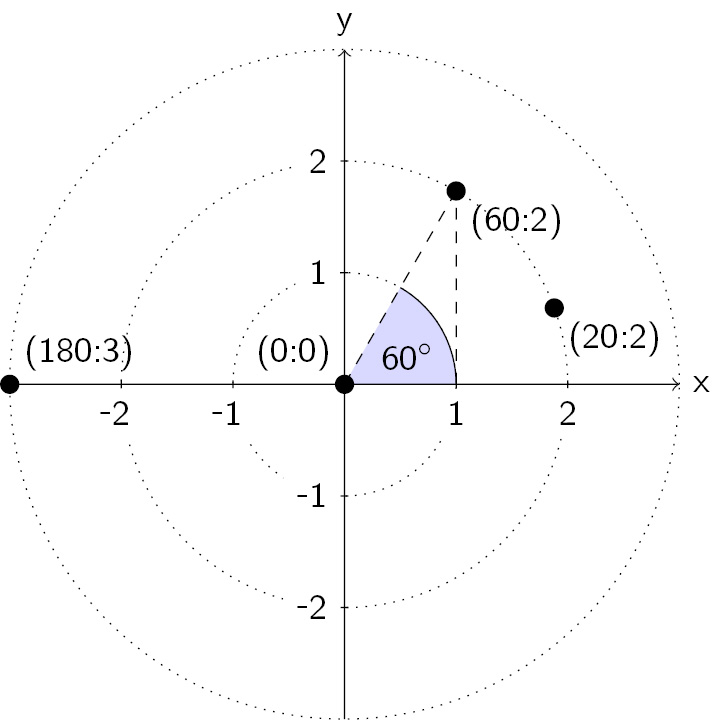
Figure 2.5 – Polar coordinate system
We have a point with the polar coordinates (60:2), which means a distance of 2 from the origin with an angle of 60 degrees to the x axis. TikZ uses a colon to distinguish it from Cartesian coordinates in polar coordinate syntax. The syntax is (angle:distance). So, (20:2) also has a distance of 2 to the origin, (0:0), and an angle of 20 degrees to the x axis, and (180:3) has a distance of 3 and an angle of 180 degrees.
Now, it becomes easier to define points for a hexagon – we specify the angles in multiples of 60 degrees, and all have the same distance from the origin, (0:0); let’s choose 2. Our drawing command becomes as follows:
  \draw[very thick, blue] (0:2) -- (60:2) -- (120:2)
    -- (180:2) --(240:2) -- (300:2) -- cycle;
With the same grid code in the LaTeX document from the previous sections, we get this result from compiling:
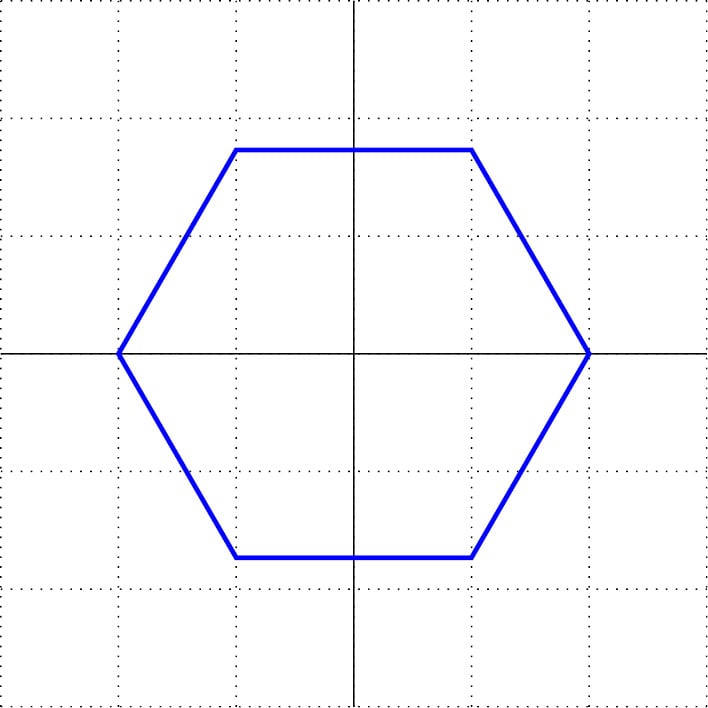
Figure 2.6 – A hexagon in polar coordinates
Polar coordinates are handy when we think of points by distance, rotation, or direction.
Until now, everything was two-dimensional; now, let’s step up by one dimension.
Three-dimensional coordinates
We could use a projection on our drawing plane if we want to draw a cube, a square, or spatial plots. The most famous is isometric projection.
TikZ provides three-dimensional coordinate systems and options. Here is a quick view of how we can use them:
- Specify x, y, and z coordinates that shall be the projection of our three-axis vectors:
\begin{tikzpicture}[x={(0.86cm,0.5cm)},y={(-0.86cm,0.5cm)}, z={(0cm,1cm)}] - Use three coordinates now. We will draw the same square as in Figure 2.3, with
0as the z value, so still in the xy plane:\draw[very thick, blue] (-2,-2,0) -- (-2,2,0)
-- (2,2,0) -- (2,-2,0) -- cycle;
For a better view, we shall again draw axes, as shown in Figure 2.3. Furthermore, we add a circle with a radius of 2. With the necessary aforementioned code highlighted, the full code example is as follows:
\documentclass[tikz,border=10pt]{standalone}
\begin{document}
\sffamily
\begin{tikzpicture}[x={(0.86cm,0.5cm)},
  y={(-0.86cm,0.5cm)}, z={(0cm,1cm)}]
  \draw[very thick, blue] (-2,-2,0) -- (-2,2,0)
   -- (2,2,0) -- (2,-2,0) -- cycle;
  \draw[->] (0,0,0) -- (2.5, 0,  0) node [right] {x};
  \draw[->] (0,0,0) -- (0,  2.5, 0) node [left] {y};
  \draw[->,dashed] (0,0,0) -- (0,  0, 2.5) node [above] {z};
  \draw circle (2);
\end{tikzpicture}
\end{document}
This gives us a skewed view, where the axes and circle help in recognizing it as a 3D isometric view:
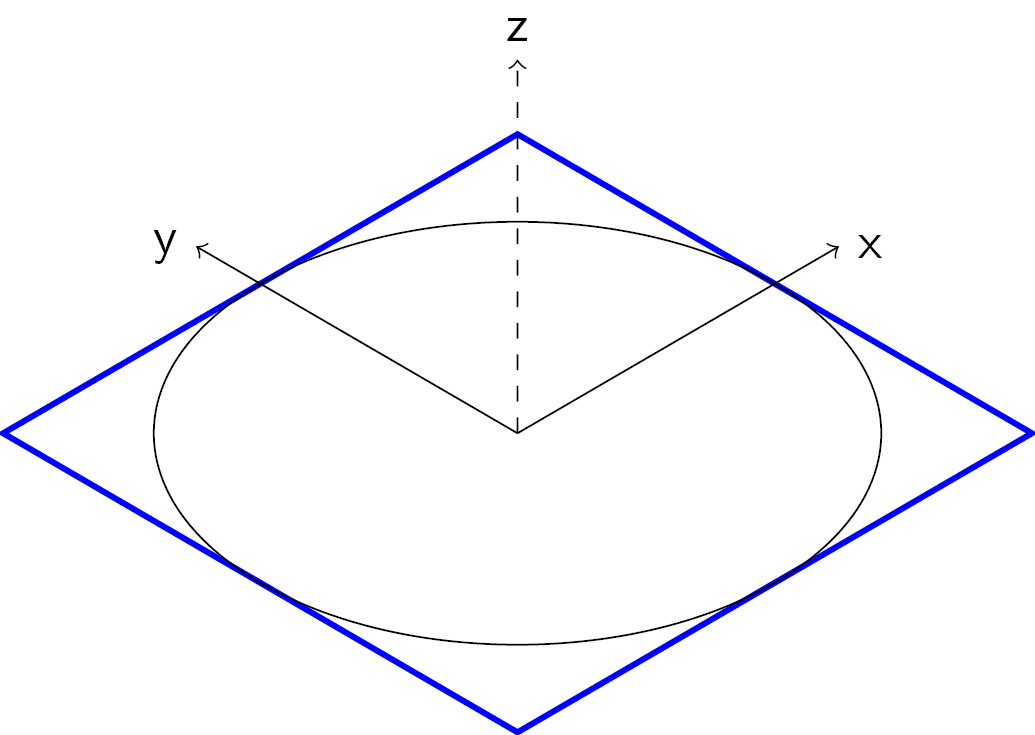
Figure 2.7 – The square and circle in three dimensions
In later chapters, we will work with additional libraries and packages for three-dimensional drawing.
Until now, we have used only absolute coordinates, which refer to the origin and axes. How about a reference to another point, with a distance or angle? We will now look at that.
Using relative coordinates
When we use \draw with a sequence of coordinates, we can state the relative position to the first coordinate by adding a + sign. So, +(4,2) means the new coordinate is plus 4 in the x direction and plus 2 in the y direction. Note that with +, it is always relative to the first coordinate in this path section.
Let’s try this in our code with the grid from Figure 2.3:
\draw[very thick, blue] (-3,-1) -- +(1,0)
  -- +(2,2) -- +(4,2) -- +(5,0) -- +(6,0);
Compile, and you get the following:
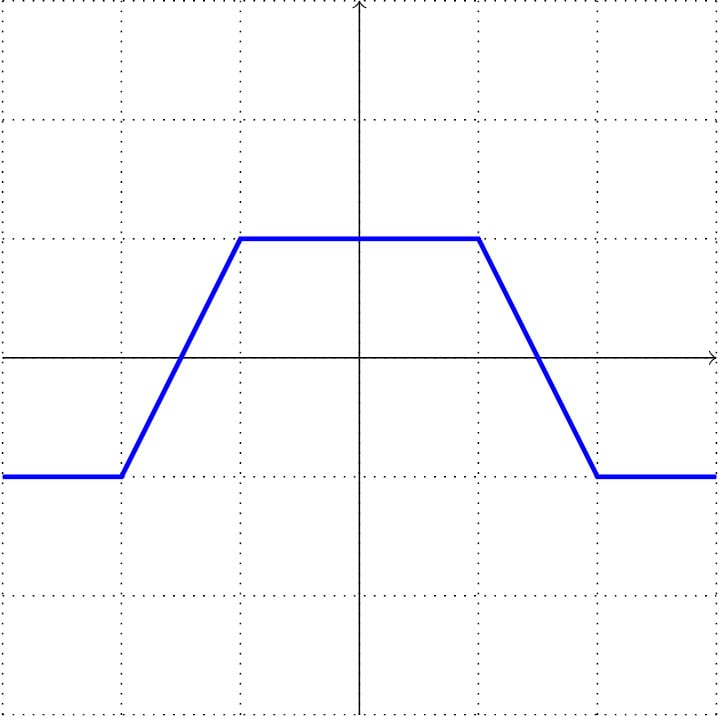
Figure 2.8 – Drawing with relative coordinates
That’s not so handy – always looking back to the first coordinate. Luckily, TikZ offers another syntax with double plus signs. For example, ++(1,2) means plus one in the x direction and plus 2 in the y direction, but from the previous point. That means we can move step by step.
The modified drawing command for the same output is as follows:
\draw[very thick, blue] (-3,-1) -- ++(1,0)
  -- ++(1,2) -- ++(2,0) -- ++(1,-2) -- ++(1,0);
We get the same drawing as shown in Figure 2.8; currently, it’s much easier to follow the movement from one coordinate to the next. That’s why this syntax is pretty popular. Remember that -- here is not the negative version of ++; it’s the line element. The use of -- ++ together can look confusing, but they are two different things – a line and a relative positioning modifier.
Using units
You may already have wondered what a coordinate, (1,2), or a radius of 2 can mean in a document regarding the size of the PDF. Mathematically, in a coordinate system, it’s clear, but in a document, we need actual width, height, and lengths.
So, by default, 1 means 1 cm. You can use any LaTeX dimension, so you can also write (8mm,20pt) as a coordinate or (60:1in) for 60 degrees with a 1-inch distance.
You can change the default unit lengths of 1 cm to any thing else you like. If you write \begin
{tikzpicture}[x=3cm,y=2cm](2,2) would mean the point, (6cm,4cm). It’s an easy way of changing the dimensions of a complete TikZ drawing. For example, change x and y to be twice as big in the tikzpicture options to double a picture in size.
We have now seen how to draw lines, circles, and a grid. Let’s look at more shapes now.


