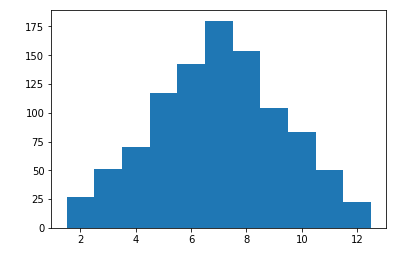
In this example, we generate a histogram of random numbers. In this case, we are simulating rolling dice 1,000 times and recording the resultant face value.
Generating a histogram using Python
How to do it...
We can use this Python script:
import pylab
import random

random.seed(113)

samples = 1000
dice = []
for i in range(samples):
 total = random.randint(1,6) + random.randint(1,6)
 dice.append(total)

pylab.hist(dice, bins= pylab.arange(1.5,12.6,1.0))
pylab.show()
This results in a histogram display:

This is the graph showing almost exactly what we expected. I imagine that with a higher cycle count, we would have got closer to a pure pyramid peaking at 7.


