Search icon CANCEL
Subscription
0
Cart icon
Cart
Close icon
You have no products in your basket yet
Save more on your purchases!
Savings automatically calculated. No voucher code required
Arrow left icon
All Products
Best Sellers
New Releases
Books
Videos
Audiobooks
Learning Hub
Newsletters
Free Learning
Arrow right icon
Arrow up icon
GO TO TOP
Implementing Splunk: Big Data Reporting and Development for Operational Intelligence

You're reading from  Implementing Splunk: Big Data Reporting and Development for Operational Intelligence

Product type Book
Published in Jan 2013
Publisher Packt
ISBN-13 9781849693288
Pages 448 pages
Edition 1st Edition
Languages
Concepts
Author (1):
VINCENT BUMGARNER VINCENT BUMGARNER
Profile icon VINCENT BUMGARNER

Table of Contents (19) Chapters

Implementing Splunk: Big Data Reporting and Development for Operational Intelligence
Credits
About the Author
About the Reviewers
www.PacktPub.com
Preface
1. The Splunk Interface 2. Understanding Search 3. Tables, Charts, and Fields 4. Simple XML Dashboards 5. Advanced Search Examples 6. Extending Search 7. Working with Apps 8. Building Advanced Dashboards 9. Summary Indexes and CSV Files 10. Configuring Splunk 11. Advanced Deployments 12. Extending Splunk Index

Using timechart to show values over time


timechart lets us show numerical values over time. It is similar to the chart command, except that time is always plotted on the x axis. Here are a couple of things to note:

  • The events must have an _time field. If you are simply sending the results of a search to timechart, this will always be true. If you are using interim commands, you will need to be mindful of this requirement.

  • Time is always "bucketed", meaning that there is no way to draw a point per event.

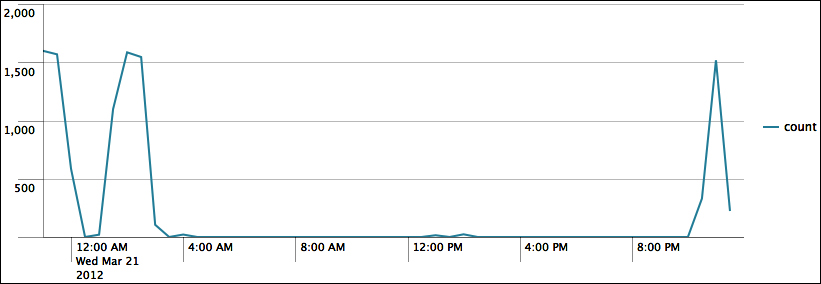
Let's see how many errors have been occurring:

sourcetype="impl_splunk_gen" error | timechart count

The default chart will look something like this:

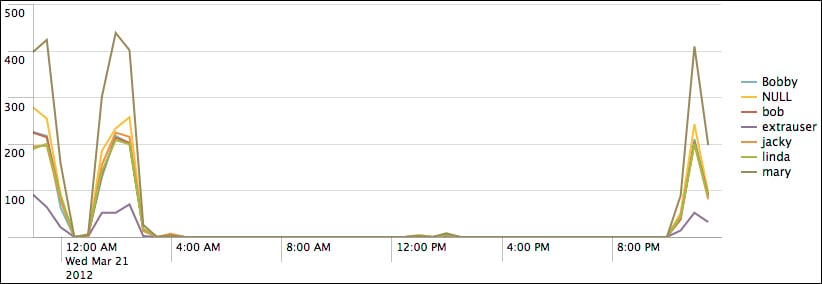
Now let's see how many errors have occurred per user over the same time period. We simply need to add by user to the query:

sourcetype="impl_splunk_gen" error | timechart count by user

This produces the following chart:

As we stated before, the x axis is always time. The y axis can be:

  • One or more functions

  • A single function with a by clause

  • Multiple functions...

lock icon The rest of the chapter is locked
Register for a free Packt account to unlock a world of extra content!
A free Packt account unlocks extra newsletters, articles, discounted offers, and much more. Start advancing your knowledge today.
Unlock this book and the full library FREE for 7 days
Get unlimited access to 7000+ expert-authored eBooks and videos courses covering every tech area you can think of
Renews at €14.99/month. Cancel anytime}