Search icon CANCEL
Subscription
0
Cart icon
Cart
Close icon
You have no products in your basket yet
Save more on your purchases!
Savings automatically calculated. No voucher code required
Arrow left icon
All Products
Best Sellers
New Releases
Books
Videos
Audiobooks
Learning Hub
Newsletters
Free Learning
Arrow right icon
Arrow up icon
GO TO TOP
Implementing Splunk: Big Data Reporting and Development for Operational Intelligence

You're reading from  Implementing Splunk: Big Data Reporting and Development for Operational Intelligence

Product type Book
Published in Jan 2013
Publisher Packt
ISBN-13 9781849693288
Pages 448 pages
Edition 1st Edition
Languages
Concepts
Author (1):
VINCENT BUMGARNER VINCENT BUMGARNER
Profile icon VINCENT BUMGARNER

Table of Contents (19) Chapters

Implementing Splunk: Big Data Reporting and Development for Operational Intelligence
Credits
About the Author
About the Reviewers
www.PacktPub.com
Preface
1. The Splunk Interface 2. Understanding Search 3. Tables, Charts, and Fields 4. Simple XML Dashboards 5. Advanced Search Examples 6. Extending Search 7. Working with Apps 8. Building Advanced Dashboards 9. Summary Indexes and CSV Files 10. Configuring Splunk 11. Advanced Deployments 12. Extending Splunk Index

Using chart to turn data


The chart command is useful for "turning" data across two dimensions. It is useful for both tables and charts. Let's start with one of our examples from stats:

sourcetype="impl_splunk_gen" error | chart count over logger by user

The resulting table looks like this:

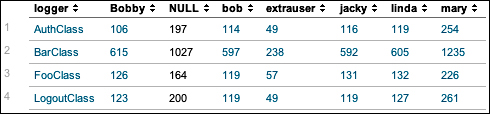
If you look back at the results from stats, the data is presented as one row per combination. Instead of a row per combination, chart generates the intersection of the two fields. You can specify multiple functions, but you may only specify one field each for over and by.

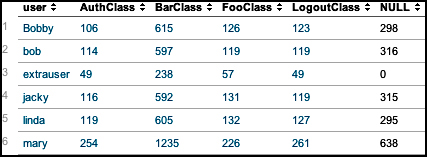
Switching the fields turns the data the other way.

By simply clicking on the chart icon above the table, we can see these results in a chart:

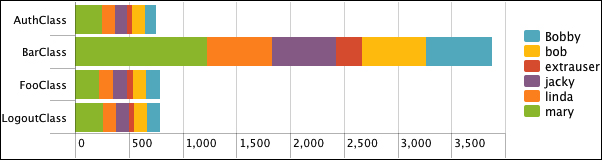
This is a bar chart, with Stack mode set to Stacked, and usenull set to false, like so:

sourcetype="impl_splunk_gen" error
  | chart usenull=false count over logger by user

chart can also be used to simply turn data, even if the data is non-numerical. For example, say we enter this query:

sourcetype="impl_splunk_gen...
lock icon The rest of the chapter is locked
Register for a free Packt account to unlock a world of extra content!
A free Packt account unlocks extra newsletters, articles, discounted offers, and much more. Start advancing your knowledge today.
Unlock this book and the full library FREE for 7 days
Get unlimited access to 7000+ expert-authored eBooks and videos courses covering every tech area you can think of
Renews at €14.99/month. Cancel anytime}