Search icon CANCEL
Arrow left icon
Explore Products
Best Sellers
New Releases
Books
Videos
Audiobooks
Learning Hub
Conferences
Free Learning
Arrow right icon
Arrow up icon
GO TO TOP
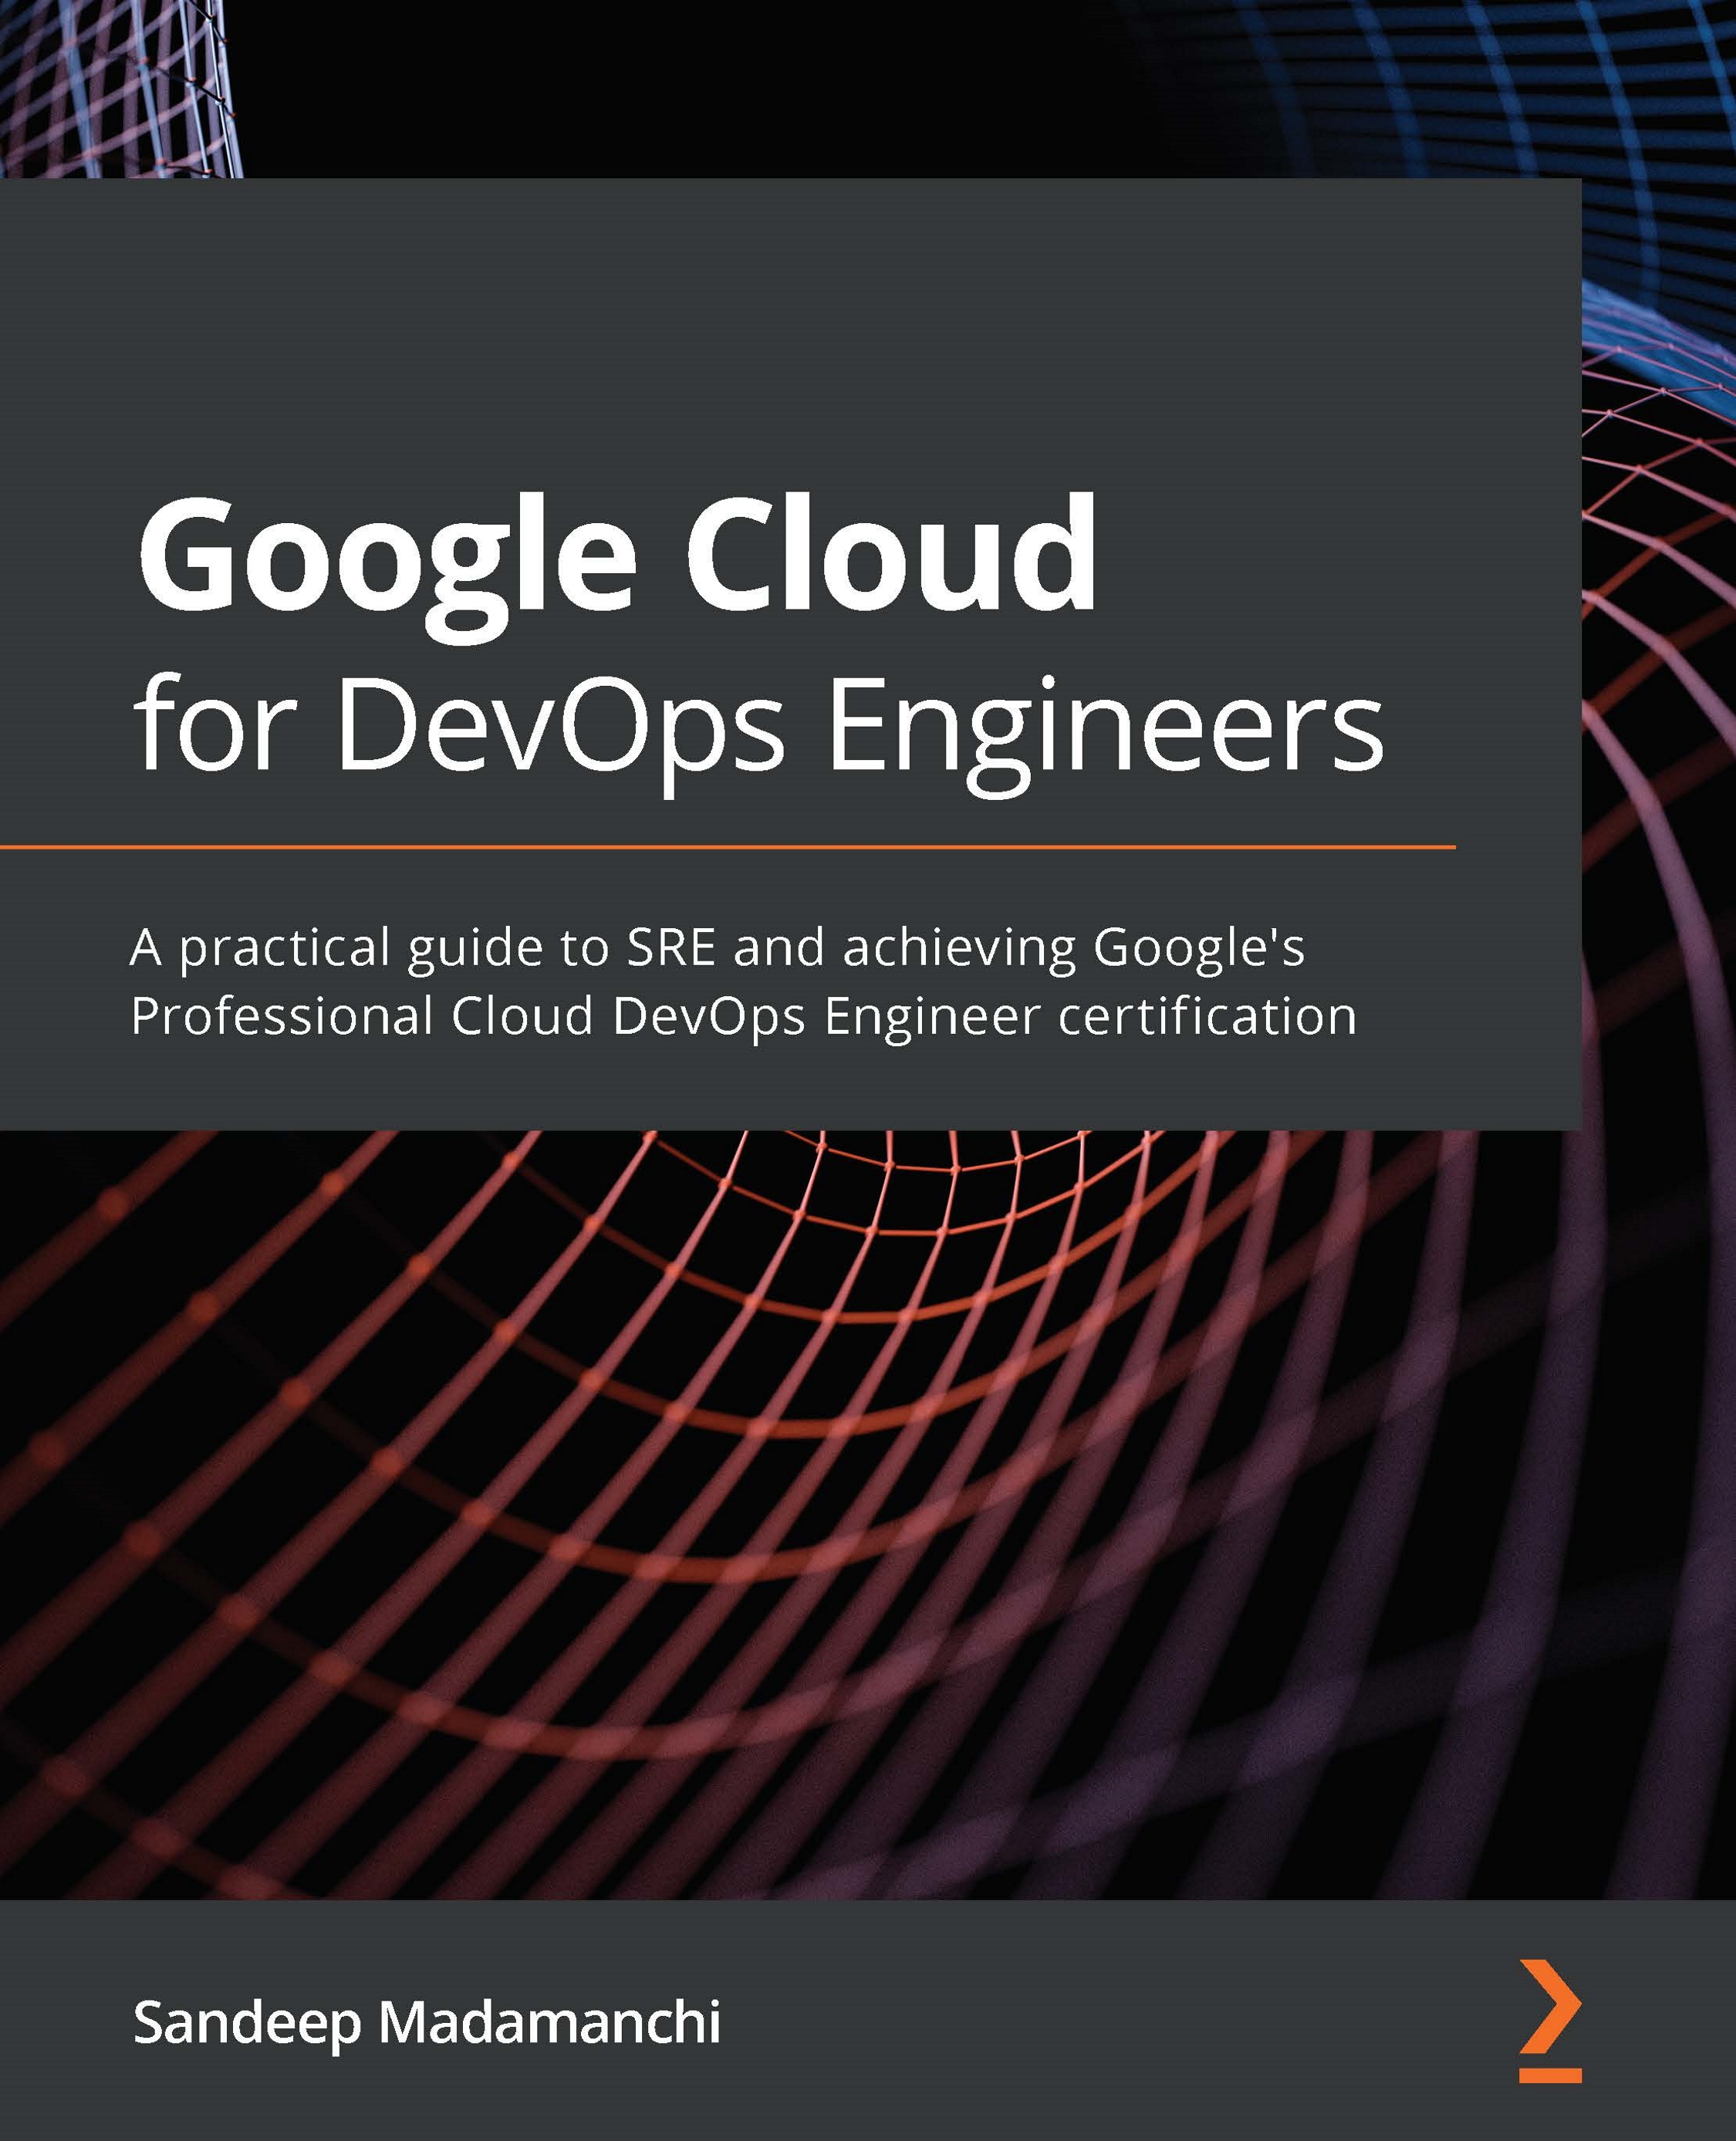
Google Cloud for DevOps Engineers

You're reading from   Google Cloud for DevOps Engineers A practical guide to SRE and achieving Google's Professional Cloud DevOps Engineer certification

Arrow left icon
Product type Paperback
Published in Jul 2021
Publisher Packt
ISBN-13 9781839218019
Length 482 pages
Edition 1st Edition
Concepts
Arrow right icon
Author (1):
Arrow left icon
Sandeep Madamanchi Sandeep Madamanchi
Author Profile Icon Sandeep Madamanchi
Sandeep Madamanchi
Arrow right icon
View More author details
Toc

Table of Contents (17) Chapters Close

Preface 1. Section 1: Site Reliability Engineering – A Prescriptive Way to Implement DevOps
2. Chapter 1: DevOps, SRE, and Google Cloud Services for CI/CD FREE CHAPTER 3. Chapter 2: SRE Technical Practices – Deep Dive 4. Chapter 3: Understanding Monitoring and Alerting to Target Reliability 5. Chapter 4: Building SRE Teams and Applying Cultural Practices 6. Section 2: Google Cloud Services to Implement DevOps via CI/CD
7. Chapter 5: Managing Source Code Using Cloud Source Repositories 8. Chapter 6: Building Code Using Cloud Build, and Pushing to Container Registry 9. Chapter 7: Understanding Kubernetes Essentials to Deploy Containerized Applications 10. Chapter 8: Understanding GKE Essentials to Deploy Containerized Applications 11. Chapter 9: Securing the Cluster Using GKE Security Constructs 12. Chapter 10: Exploring GCP Cloud Operations 13. Mock Exam 1 14. Mock Exam 2 15. Other Books You May Enjoy Appendix: Getting Ready for Professional Cloud DevOps Engineer Certification

Points to remember

The following are some important points to remember:

  • Cloud Monitoring is a GCP service that collects metrics, events, and metadata from multi-cloud and hybrid infrastructures in real time.
  • A workspace provides a single pane of glass related to GCP resources.
  • A workspace can monitor resources from multiple monitored projects.
  • A monitored project, however, can only be associated with a single workspace.
  • Dashboards provide a graphical representation of key signal data, called metrics, in a manner that is suitable for end users or the operations team.
  • Metrics represent numerical measurements of resource usage that can be observed and collected across the system at regular time intervals.
  • MQL can be used to create a chart with a text-based interface and uses an expressive query language to execute complex queries against time series data.
  • Uptime checks test the availability of an external facing service within a specific timeout interval...
lock icon The rest of the chapter is locked
Register for a free Packt account to unlock a world of extra content!
A free Packt account unlocks extra newsletters, articles, discounted offers, and much more. Start advancing your knowledge today.
Unlock this book and the full library FREE for 7 days
Get unlimited access to 7000+ expert-authored eBooks and videos courses covering every tech area you can think of
Renews at €18.99/month. Cancel anytime