Forwarder monitoring
Monitoring our setup is quite important as the number of forwarders grows, and it can sometimes be very challenging. To aid with this, Splunk offers the out-of-the-box MC app, which contains a dashboard to monitor the forwarders.
By default, the forwarder monitoring feature is disabled in MC and must be enabled by following these steps:
- Log in to the MC-dedicated Splunk instance and navigate to Settings | Monitoring Console.
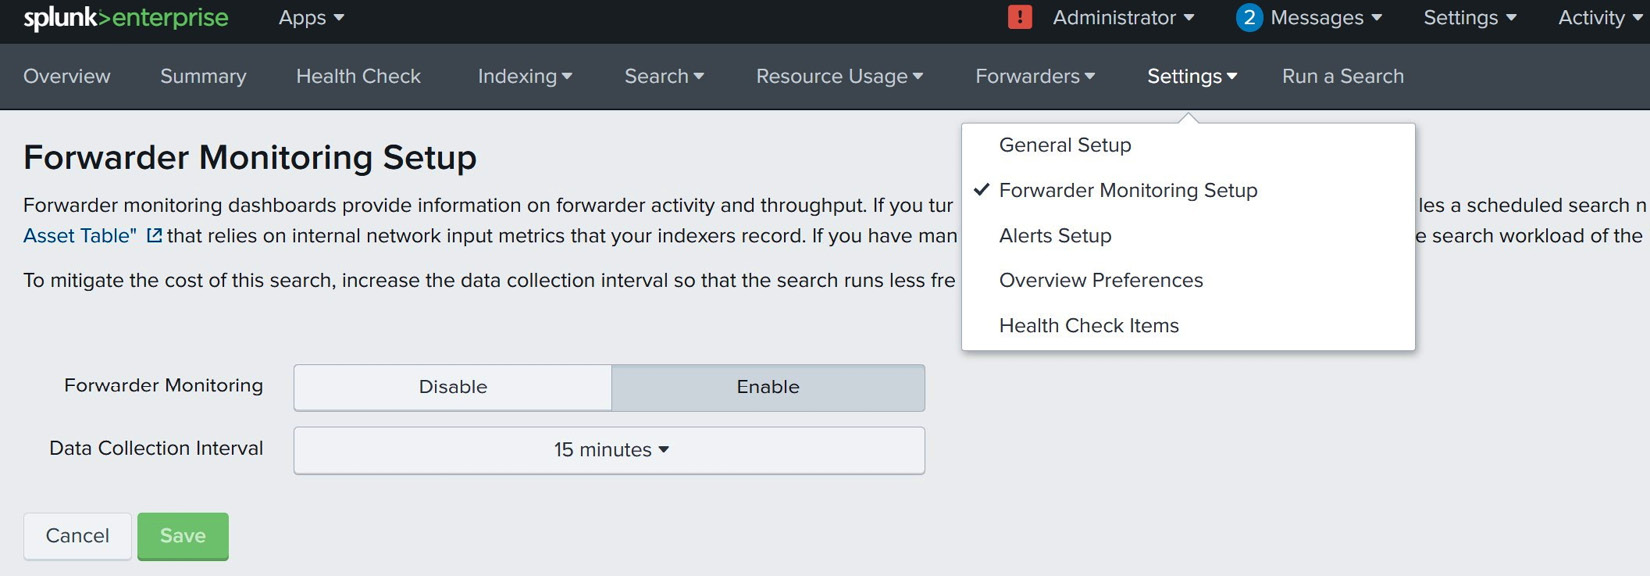
- Inside Monitoring Console, go to Settings | Forwarding Monitoring Setup; you will find that it is disabled. Click Enable. By default, Data Collection Interval is set to 15 minutes; leave it as-is and click Save, as shown in Figure 4.5:

Figure 4.5: Forwarder Monitoring Setup
You will find two menu items under the Forwarders tab: Forwarders Instance and Forwarders Deployment, as shown in Figure 4.6. The Forwarders: Instance and Forwarders: Deployment dashboards are built on the internal logs of...


