Using Fiddler to identify the cause of performance issues
Dashboards can become quite complex as it is very common to have multiple queries executing at once, especially during the initial load. When we encounter performance issues, it is very difficult to pinpoint exactly where the issue is coming from. Fortunately, we can use the Fiddler tool to help us identify the root cause of a performance-related issue.
Getting ready
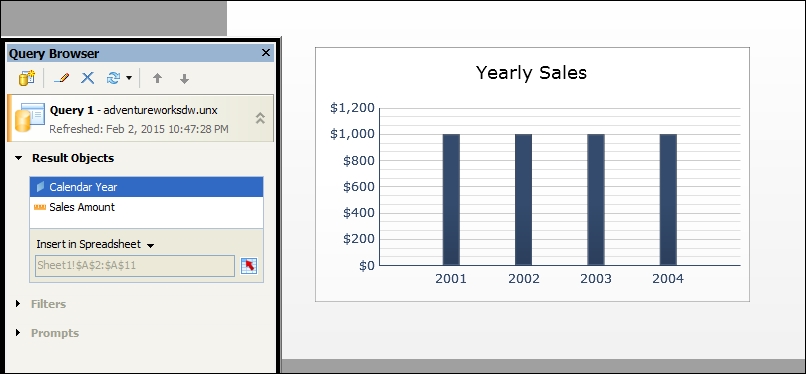
Download Fiddler from http://www.telerik.com/download/fiddler. Create a simple dashboard that contains one query and one chart. In our example, we created a query that contains the Calendar Year dimension and Sales Amount measure. The data is then plotted on a Column Chart.

How to do it…
- Make sure Fiddler is running and then Preview your dashboard.

- In Fiddler you will notice that there are three lines on the left-hand side window. The first line and last line are session initialization and session ending items. The second line is our query process. The way we can...


