Using Query Diagnostics
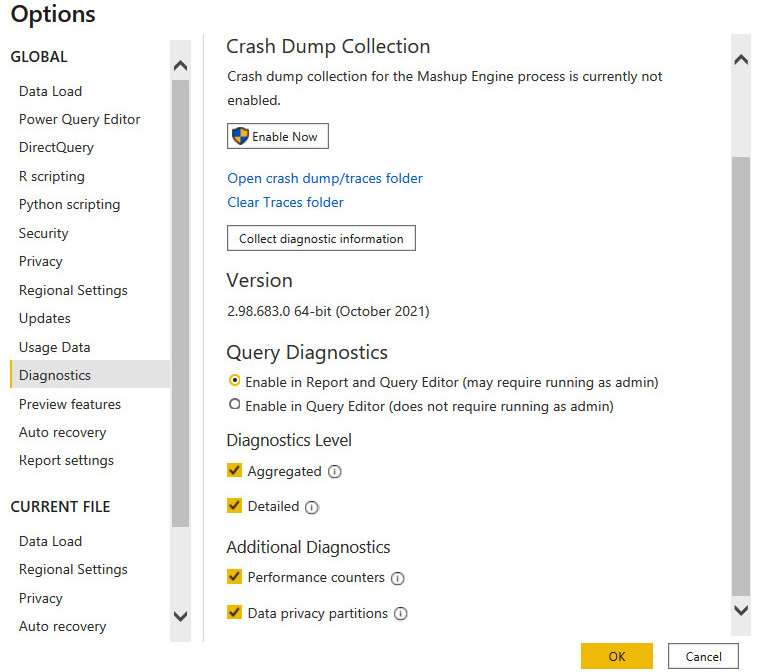
In Power BI Desktop, you can enable Query Diagnostics to get a detailed understanding of what each step of your query is doing. Even with seemingly simple queries that have few transformations, if performance is bad, you will need to know which part is slowing you down so that you can concentrate your optimization efforts. Diagnostics needs to be enabled in the Power Query settings, as shown in the following figure.

Figure 8.19 – Query Diagnostics enabled in the Power Query settings
You might not need all the traces that are shown in the previous figure. At a minimum, enable the Aggregated diagnostic level and Performance counters.
There are up to four types of logs that are available:
- Aggregated: This is a summary view that aggregates multiple related operations into a single log entry. The exclusive durations are summed per entry.
- Detailed: This is a verbose view with no aggregation. It is recommended for...


