Connecting to data
There is virtually no limit to the data that Tableau can visualize! Almost every new version of Tableau adds new native connectors. Tableau continues to add native connectors for cloud-based data. The web data connector allows you to write a connector for any online data you wish to retrieve. The Tableau Hyper API allows you to programmatically read and write extracts of data, enabling you to access data from any source and write it to a native Tableau format. Additionally, for any database without a built-in connection, Tableau gives you the ability to use a generic ODBC connection.
You may have multiple data sources in the same workbook. Each source will show up under the Data tab on the left sidebar.
Although the terms are often used interchangeably, it is helpful to make a distinction. A connection technically refers to the connection made to data in a single location, such as tables in a single database, or files of the same type in the same directory structure. A data source may contain more than one connection that can be joined together, such as a table in SQL Server joined to tables in a Snowflake database that are joined to an Excel table. You can think about it this way: a Tableau workbook may contain one or more data sources and each data source may contain one or more connections. We'll maintain this distinction throughout the book.
This section will focus on a few practical examples of connecting to various data sources. There's no way to cover every possible type of connection but we will cover several that are representative of others. You may or may not have access to some of the data sources in the following examples. Don't worry if you aren't able to follow each example. Merely observe the differences.
Connecting to data in a file
File-based data includes all sources of data where the data is stored in a file. File-based data sources include the following:
- Extracts: A
.hyperor.tdefile containing data that was extracted from an original source. - Microsoft Access: An
.mdbor.accdbdatabase file created in Access. - Microsoft Excel: An
.xls,.xlsx, or.xlsmspreadsheet created in Excel. Multiple Excel sheets or sub-tables may be joined or unioned together in a single connection. - Text file: A delimited text file, most commonly
.txt,.csv, or.tab. Multiple text files in a single directory may be joined or unioned together in a single connection. - Local cube file: A
.cubfile that contains multi-dimensional data. These files are typically exported from OLAP databases. - Adobe PDF: A
.pdffile that may contain tables of data that can be parsed by Tableau. - Spatial file: A wide variety of spatial formats are supported such as
.kml,.shp,.tab,.mif, spatial JSON, and ESRI database files. These formats contain spatial objects that can be rendered by Tableau. - Statistical file: A
.sav,.sas7bdat,.rda, or.rdatafile generated by statistical tools, such as SAS or R. - JSON file: A
.jsonfile that contains data in JSON format.
In addition to those mentioned previously, you can connect to Tableau files to import connections that you have saved in another Tableau workbook (.twb or .twbx). The connection will be imported, and changes will only affect the current workbook.
Follow this example to see a connection to an Excel file:
- Navigate to the Connect to Excel sheet in the
Chapter 02 Starter.twbxworkbook. - From the menu, select Data | New Data Source and select Microsoft Excel from the list of possible connections.
- In the open dialogue, open the
Superstore.xlsxfile from the\Learning Tableau\Chapter 02directory. Tableau will open the Data Source screen. You should see the two sheets of the Excel document listed on the left. - Double-click the Orders sheet and then the Returns sheet. Tableau will prompt you with an Edit Relationship dialog. We'll cover relationships in depth in Chapter 13, Understanding the Tableau Data Model, Joins, and Blends. For now, accept the defaults by closing the dialog.
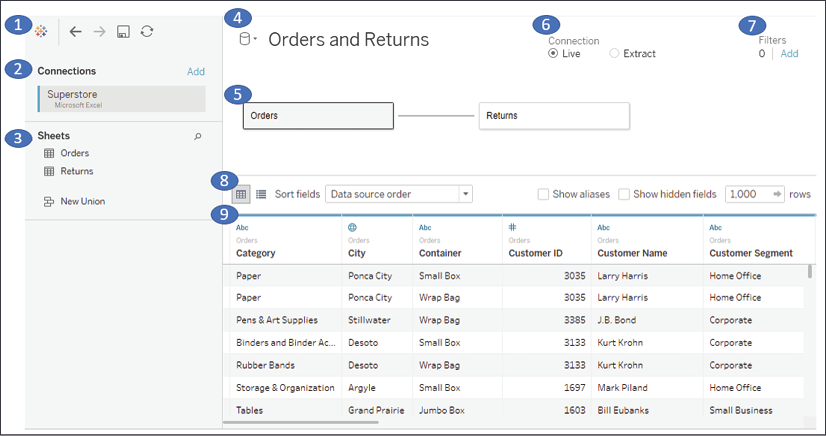
Your data source screen should look similar to the following screenshot:

Figure 2.8: The data source screen with two objects (Orders and Returns)
Take some time to familiarize yourself with the Data Source screen interface, which has the following features (numbered in the preceding screenshot):
- Toolbar: The toolbar has a few of the familiar controls, including undo, redo, and save. It also includes the option to refresh the current data source.
- Connections: All the connections in the current data source. Click Add to add a new connection to the current data source. This allows you to join data across different connection types. Each connection will be color-coded so that you can distinguish what data is coming from which connection.
- Sheets (or Tables): This lists all the tables of data available for a given connection. This includes sheets, sub-tables, and named ranges for Excel; tables, views, and stored procedures for relational databases; and other connection-dependent options, such as New Union or Custom SQL.
- Data Source Name: This is the name of the currently selected data source. You may select a different data source using the drop-down arrow next to the database icon. You may click the name of the data source to edit it.
- Object / Data Model Canvas: Drop sheets and tables from the left into this area to make them part of the connection. You may add additional tables by dragging and dropping or double-clicking them. Each will be added as an object to the object model. You may also add tables as unions or double-click an object to edit the underlying tables and joins. We'll cover the details extensively in Chapter 13, Understanding the Tableau Data Model, Joins, and Blends. For now, simply note that Orders and Returns are related together by the Order ID.
- Live or Extract Options: For many data sources, you may choose whether you would like to have a live connection or an extracted connection. We'll look at these in further detail later in the chapter.
- Data Source Filters: You may add filters to the data source. These will be applied at the data-source level, and thus to all views of the data using this data source in the workbook.
- Preview Pane Options: These options allow you to specify whether you'd like to see a preview of the data or a list of metadata, and how you would like to preview the data (examples include alias values, hidden fields shown, and how many rows you'd like to preview).
- Preview Pane/Metadata View: Depending on your selection in the options, this space either displays a preview of data or a list of all fields with additional metadata. Notice that these views give you a wide array of options, such as changing data types, hiding or renaming fields, and applying various data transformation functions. We'll consider some of these options in this and later chapters.
Once you have created and configured your data source, you may click any sheet to start using it.
Conclude this exercise with the following steps:
- Click the data source name to edit the text and rename the data source to
Orders and Returns.
- Navigate to the Connect to Excel sheet and, using the
Orders and Returnsdata source, create a time series showing Returns (Count) by Return Reason. Your view should look like the following screenshot:
Figure 2.9: The number of returns by return reason
If you need to edit the connection at any time, select Data from the menu, locate your connection, and then select Edit Data Source.... Alternately, you may right-click any data source under the Data tab on the left sidebar and select Edit Data Source..., or click the Data Source tab in the lower-left corner. You may access the data source screen at any time by clicking the Data Source tab in the lower-left corner of Tableau Desktop.
Connecting to data on a server
Database servers, such as SQL Server, Snowflake, Vertica, and Oracle, host data on one or more server machines and use powerful database engines to store, aggregate, sort, and serve data based on queries from client applications. Tableau can leverage the capabilities of these servers to retrieve data for visualization and analysis. Alternately, data can be extracted from these sources and stored in an extract.
As an example of connecting to a server data source, we'll demonstrate connecting to SQL Server. If you have access to a server-based data source, you may wish to create a new data source and explore the details. However, this specific example is not included in the workbook in this chapter.
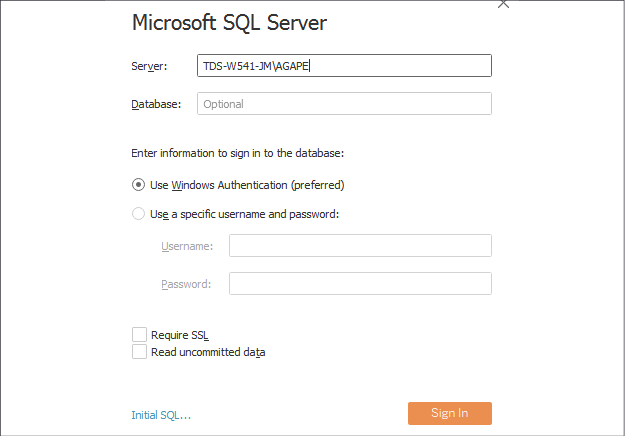
As soon as the Microsoft SQL Server connection is selected, the interface displays options for some initial configuration as follows:

Figure 2.10: The connection editor for Microsoft SQL Server
A connection to SQL Server requires the Server name, as well as authentication information.
A database administrator can configure SQL Server to Use Windows Authentication or a SQL Server username and password. With SQL Server, you can also optionally allow reading uncommitted data. This can potentially improve performance but may also lead to unpredictable results if data is being inserted, updated, or deleted at the same time as Tableau is querying. Additionally, you may specify SQL to be run at connect time using the Initial SQL... link in the lower-left corner.
In order to maintain high standards of security, Tableau will not save a password as part of a data source connection. This means that if you share a workbook using a live connection with someone else, they will need to have credentials to access the data. This also means that when you first open the workbook, you will need to re-enter your password for any connections requiring a password.
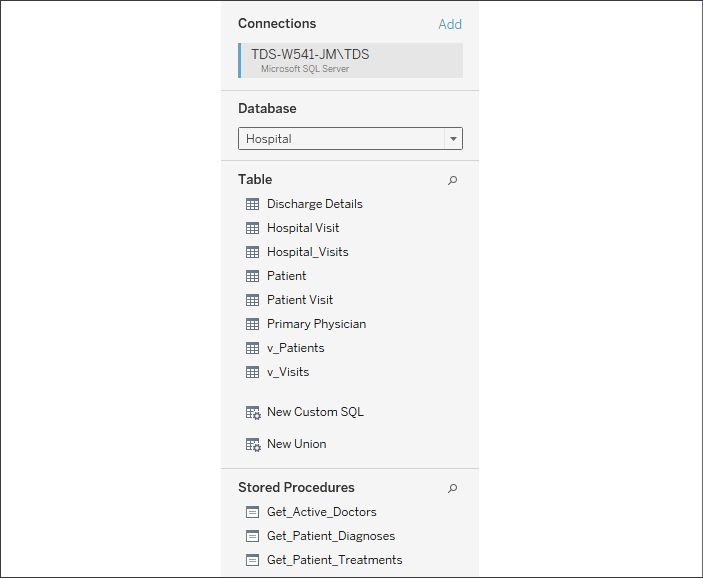
Once you click the orange Sign In button, you will see a screen that is very similar to the connection screen you saw for Excel. The main difference is on the left, where you have an option for selecting a Database, as shown in the following screenshot:

Figure 2.11: Once connected to a database, Tableau will display tables, views, and stored procedures as options to add to the object model
Once you've selected a database, you will see the following:
- Table: This shows any data tables or views contained in the selected database.
- New Custom SQL: You may write your own custom SQL scripts and add them as tables. You may join these as you would any other table or view.
- New Union: You may union together tables in the database. Tableau will match fields based on name and data type, and you may additionally merge fields as needed.
- Stored Procedures: You may use a stored procedure that returns a table of data. You will be given the option of setting values for stored procedure parameters or using or creating a Tableau parameter to pass values.
Once you have finished configuring the connection, click a tab for any sheet to begin visualizing the data.
Using extracts
Any data source that is using an extract will have a distinctive icon that indicates the data has been pulled from an original source into an extract, as shown in the following screenshot:

Figure 2.12: The icon next to a data source indicates whether it is extracted or not
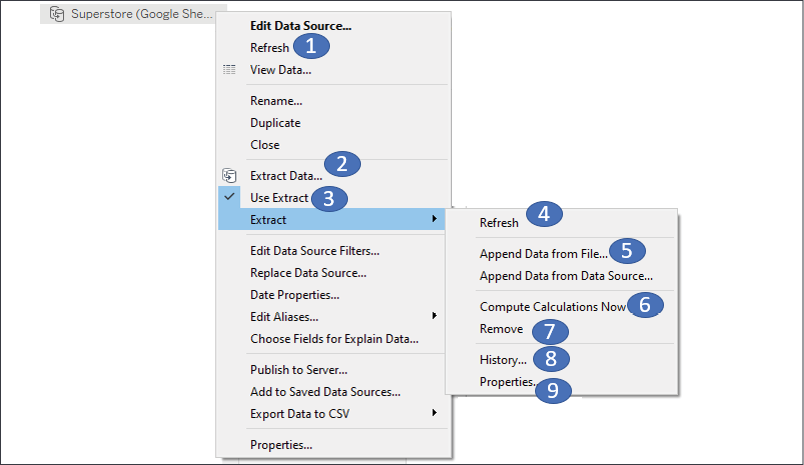
The first data connection in the preceding data pane is extracted, while the second is not. After an extract has been created, you may choose to use the extract or not. When you right-click a data source (or Data from the menu and then the data source), you will see the following menu options:

Figure 2.13: The context menu for a data connection in the Data pane with Extract options numbered
Let's cover them in more detail:
- Refresh: The Refresh option under the data source simply tells Tableau to refresh the local cache of data. With a live data source, this would re-query the underlying data. With an extracted source, the cache is cleared and the extract is required, but this Refresh option does not update the extract from the original source. To do that, use Refresh under the Extract sub-menu (see number 4 in this list).
- Extract Data...: This creates a new extract from the data source (replacing an existing extract if it exists).
- Use Extract: This option is enabled if there is an extract for a given data source. Unchecking the option will tell Tableau to use a live connection instead of the extract. The extract will not be removed and may be used again by checking this option at any time. If the original data source is not available to this workbook, Tableau will ask where to find it.
- Refresh: This Refresh option refreshes the extract with data from the original source. It does not optimize the extract for some changes you make (such as hiding fields or creating new calculations).
- Append Data from File... or Append Data from Data Source…:These options allow you to append additional files or data sources to an existing extract, provided they have the same exact data structure as the original source. This adds rows to your existing extract; it will not add new columns.
- Compute Calculations Now: This will restructure the extract, based on changes you've made since originally creating the extract, to make it as efficient as possible. Certain calculated fields may be materialized (that is, calculated once so that the resulting value can be stored) and newly hidden columns or deleted calculations will be removed from the extract.
- Remove: This removes the definition of the extract, optionally deletes the extract file, and resumes a live connection to the original data source.
- History: This allows you to view the history of the extract and refreshes.
- Properties: This enables you to view the properties of the extract, such as the location, underlying source, filters, and row limits.
Let's next consider the performance ramifications of using extracts.
Connecting to data in the cloud
Certain data connections are made to data that is hosted in the cloud. These include Amazon RDS, Google BigQuery, Microsoft SQL Azure, Snowflake, Salesforce, Google Sheets, and many others. It is beyond the scope of this book to cover each connection in depth, but as an example of a cloud data source, we'll consider connecting to Google Sheets.
Google Sheets allows users to create and maintain spreadsheets of data online. Sheets may be shared and collaborated on by many different users. Here, we'll walk through an example of connecting to a sheet that is shared via a link.
To follow the example, you'll need a free Google account. With your credentials, follow these steps:
- Click the Add new data source button on the toolbar, as shown here:

Figure 2.14: The Add Data button
- Select Google Sheets from the list of possible data sources. You may use the search box to quickly narrow the list.
- On the next screen, sign in to your Google account and allow Tableau Desktop the appropriate permissions. You will then be presented with a list of all your Google Sheets, along with preview and search capabilities, as shown in the following screenshot:

Figure 2.15: You may select any Google Sheet you have permissions to view or you may enter the URL for a shared sheet
- Enter the following URL (for convenience, it is included in the
Chapter 02 Starterworkbook in the Connect to Google Sheets tab, and may be copied and pasted) into the search box and click the Search button: https://docs.google.com/spreadsheets/d/1fWMGkPt0o7sdbW50tG4QLSZDwkjNO9X0mCkw-LKYu1A/edit?usp=sharing: - Select the resulting
Superstoresheet in the list and then click the Connect button. You should now see the Data Source screen. - Click the Data Source name to rename it to
Superstore (Google Sheets):
Figure 2.16: Renaming a Data Source
- For the purpose of this example, switch the connection option from Live to Extract. When connecting to your own Google Sheets data, you may choose either Live or Extract:

Figure 2.17: Switch between Live and Extract, Edit extract options, and Add Filters
- Click the tab for the Connect to Google Sheets sheet. You will be prompted for a location to save the extract. Accept the default name and save it in the
Learning Tableau\Chapter 02directory (selecting Yes to overwrite the existing file if needed). The data should be extracted within a few seconds.
- Create a filled map of Profit by State, with Profit defining the Color and Label:

Figure 2.18: The filled map demonstrates the ability to connect to a cloud-based data source
If your location is outside the United States, you may need to change your regional settings for Tableau to properly show the states in the map. Use the menu and select File | Workbook Locale | More and select English (United States).
Now that we've seen a few specific examples of connecting to data, let's consider some shortcuts and how to manage our data sources.
Shortcuts for connecting to data
You can make certain connections very quickly. These options will allow you to begin analyzing more quickly:
- Paste data from the clipboard. If you have copied data in your system's clipboard from any source (for example, a spreadsheet, a table on a web page, or a text file), you can then paste the data directly into Tableau. This can be done using Ctrl + V, or Data | Paste Data from the menu. The data will be stored as a file and you will be alerted to its location when you save the workbook.
- Select File | Open from the menu. This will allow you to open any data file that Tableau supports, such as text files, Excel files, Access files (not available on macOS), spatial files, statistical files, JSON, and even offline cube (
.cub) files. - Drag and drop a file from Windows Explorer or Finder onto the Tableau workspace. Any valid file-based data source can be dropped onto the Tableau workspace or even the Tableau shortcut on your desktop or taskbar.
- Duplicate an existing data source. You can duplicate an existing data source by right-clicking and selecting Duplicate.
These shortcuts provide a quick way for analyzing the data you need. Let's turn our attention to managing the data sources.


