Search icon CANCEL
Subscription
0
Cart icon
Close icon
You have no products in your basket yet
Save more on your purchases!
Savings automatically calculated. No voucher code required
Arrow left icon
All Products
Best Sellers
New Releases
Books
Videos
Audiobooks
Learning Hub
Newsletters
Free Learning
Arrow right icon
Learning Tableau 2020 - Fourth Edition

You're reading from  Learning Tableau 2020 - Fourth Edition

Product type Book
Published in Aug 2020
Publisher Packt
ISBN-13 9781800200364
Pages 576 pages
Edition 4th Edition
Languages
Author (1):
Joshua N. Milligan Joshua N. Milligan
Profile icon Joshua N. Milligan

Table of Contents (19) Chapters

Preface 1. Taking Off with Tableau 2. Connecting to Data in Tableau 3. Moving Beyond Basic Visualizations 4. Starting an Adventure with Calculations and Parameters 5. Leveraging Level of Detail Calculations 6. Diving Deep with Table Calculations 7. Making Visualizations That Look Great and Work Well 8. Telling a Data Story with Dashboards 9. Visual Analytics – Trends, Clustering, Distributions, and Forecasting 10. Advanced Visualizations 11. Dynamic Dashboards 12. Exploring Mapping and Advanced Geospatial Features 13. Understanding the Tableau Data Model, Joins, and Blends 14. Structuring Messy Data to Work Well in Tableau 15. Taming Data with Tableau Prep 16. Sharing Your Data Story 17. Other Books You May Enjoy
18. Index

Foundations for building visualizations

When you first connect to a data source such as the Superstore file, Tableau will display the data connection and the fields in the Data pane. Fields can be dragged from the data pane onto the canvas area or onto various shelves such as Rows, Columns, Color, or Size. As we'll see, the placement of the fields will result in different encodings of the data based on the type of field.

Measures and dimensions

The fields from the data source are visible in the Data pane and are divided into Measures and Dimensions. In older versions of Tableau, these are separate sections in the Data pane. In newer versions, each table will have Measures and Dimensions separated by a line:

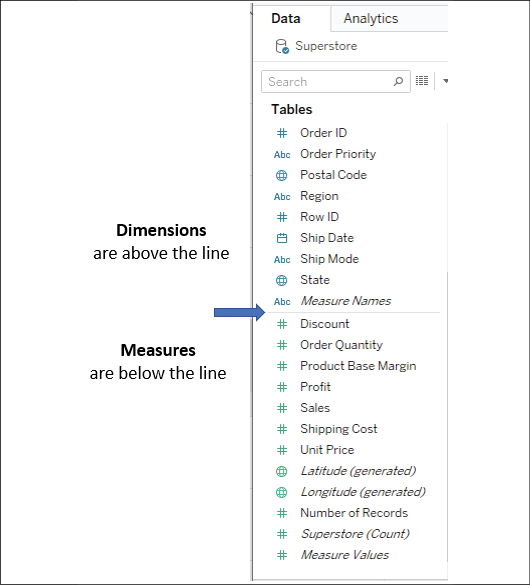
Figure 1.3: Each table (this data source only has one) has dimensions listed above the line and measures listed below the line

The difference between Measures and Dimensions is a fundamental concept to understand when using Tableau:

    ...
lock icon The rest of the chapter is locked
Register for a free Packt account to unlock a world of extra content!
A free Packt account unlocks extra newsletters, articles, discounted offers, and much more. Start advancing your knowledge today.
Unlock this book and the full library FREE for 7 days
Get unlimited access to 7000+ expert-authored eBooks and videos courses covering every tech area you can think of
Renews at €14.99/month. Cancel anytime}