Playing ns-3 simulations using NetAnim
One of the interesting and very useful features of ns-3 is the support of NetAnim. NetAnim makes executing simulations more interesting. It allows you to visualize the entire simulation execution in a bird’s eye view in terms of inspecting a variety of nodes, their configuration details, placement models, mobility models, and packet flows. Besides visualizing simulation execution using NetAnim, we can do the following interesting activities:
- Monitor and inspect various protocol packets exchanged among network nodes during a traffic flow
- Inspect network node configuration details such as IP, MAC, routing tables, and counters
- View flow-level statistics such as throughput, delay, jitter, and packet loss
In the next section, you will learn how to install and use NetAnim to visualize the simulation execution for monitoring, debugging, and analyzing activities.
How to install and use NetAnim
NetAnim’s Graphical User Interface (GUI) is implemented using Qt, a cross-platform software. In order to install the NetAnim GUI, execute the following commands:
cd ns-allinone-3.36/netanim-3.108
make clean
qmake NetAnim.pro
make
After executing the preceding commands, a NetAnim executable file is going to be created in the same directory. Then, you can open it by typing ./NetAnim. This will open NetAnim’s GUI (refer to Figure 1.16). Inside the NetAnim window, we can observe the following message: Please select an XML trace file using the file load button on the top-left corner:
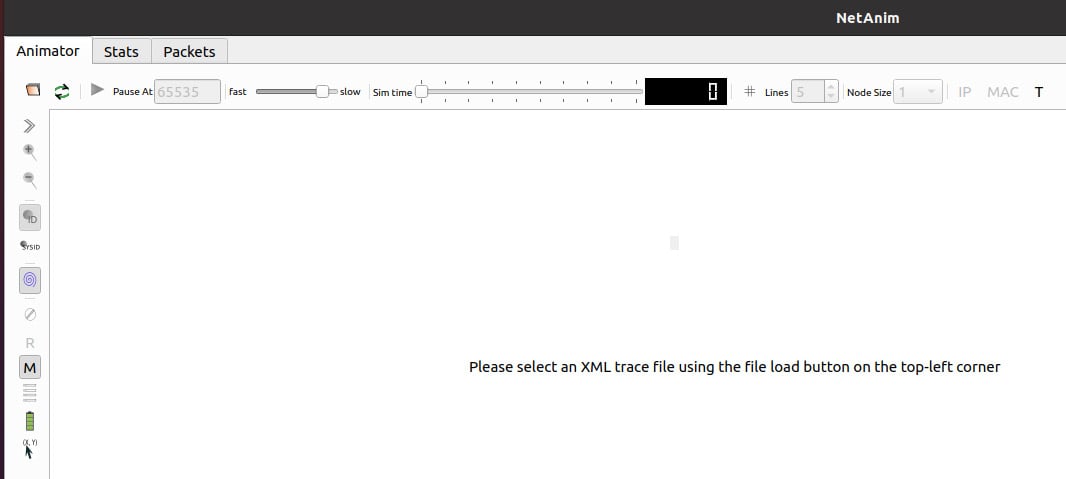
Figure 1.16 – The ns-3 NetAnim user interface
Follow these steps to visualize your simulation program execution using NetAnim:
- Include the
[#include "ns3/netanim-module.h"]header in your simulation program:- Include the following code:
AnimationInterface anim ("animation.xml");beforeSimulator::Run()in your simulation program. - Execute the program using
./ns3 run scratch/your simulation program. After successful execution, it generates ananimation.xmlfile.
- Include the following code:
- Now, you can open the
animation.xmltrace file using NetAnim to visualize your simulation.
Next, we explore NetAnim's various options for visualizing ns-3 simulations.
How to use the NetAnim GUI (panels and their menus)
In the NetAnim GUI, under the Animator tab, we can see a folder symbol. After clicking on it, select and open the animation.xml file. Then, it displays various nodes involved in your simulation. Now, you are ready to execute the simulation and visualize it using NetAnim by clicking on the play button from the main top panel menu.
The main top panel menu
In the main top panel menu (refer to Figure 1.17), from left to right, you’ll find the following options:
- The Folder option to load the animation XML file.
- The Reload option to restart the simulation.
- The Play button to start the simulation execution. On pressing this button, you can observe the change in the simulation time display, progress bar, packets exchange arrows, placement of nodes, and so on.
- By changing the speed slide bar, we can control the simulation execution speed.
- You can change the Node Size and Lines values to modify the displayed grid size and node sizes. Click on MAC or IP to display nodes’ MAC/IP details:

Figure 1.17 – The NetAnim top panel menu items
The side panel menu
In the side panel menu (refer to Figure 1.18), we can find the following important options:

Figure 1.18 – The NetAnim side panel menu items
- Step through simulation >>: If you want to see simulation execution step by step in simulation time, click the >> button. It allows you to see intermediate events that happened during the simulation execution. Reset the simulation by clicking on R.
- Stop icon: To enable or disable the display of packet exchange arrows.
- Show packet metadata icon (M): By enabling this, we can view packets and their internal details.
- To view nodes and their details clearly, you can use the zoom-in and zoom-out options.
- Show properties tree icon: Clicking on this opens a complete properties description panel for nodes (refer to Figure 1.19):
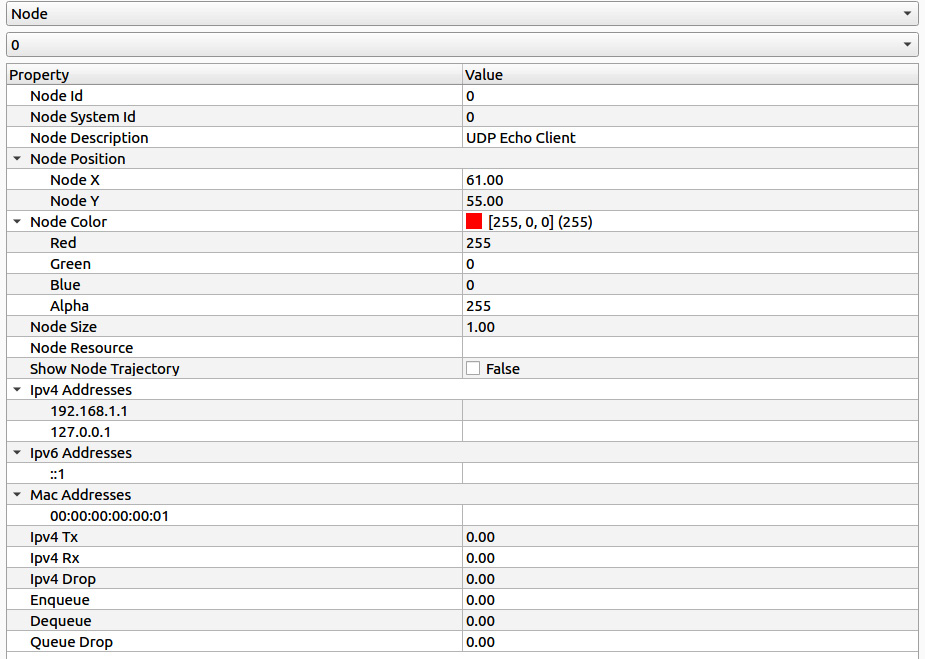
Figure 1.19 – Showing the complete description of Node-0 in our simulation
- Other icons: There is an option to toggle the display of SYS node IDs and another option to display the X and Y coordinates of the mouse pointer.
Visualizing a network simulation using NetAnim
What do you want to learn and achieve in your first network simulation visualization? Let's look at some suggestions:
- How to set up the following simple carrier-sense multiple access (CSMA) network (as shown in the comments), which connects four hosts. In ns-3, the CSMA module helps you simulate a simple shared bus network or Ethernet IEEE 802.3 and provides only basic functionality:
// Simple CSMA Network
//         192.168.1.0
// Node-0 ---- Node-1----Node-2----Node-3
//    CSMA Channel
// (Speed: 5Mbps, Propagation Delay: 6560 nano seconds)
// Install UDP Echo Client on Node-0
// Install UDP Echo Server on Node-3
- Install the UDP echo client and server applications on Node-0 and Node-1 respectively and configure the following UDP echo client application traffic characteristics:
MaxPackets: A maximum of 1,000 packets to be sent.Interval: The speed at which the echo client application should send packets. For example, settingIntervalto0.1means 10 packets are sent per second.PacketSize: 1,024 bytes set for each packet.
- We want to monitor how the UDP echo client and server exchange packets in the network.
- Generate an animation XML file that can be used later with NetAnim. We want to visualize routing tables, packet counter values, and flow statistics using NetAnim.
- View flow-level metrics such as throughput, delay, jitter, and packet loss.
Now, we are going to explain step-by-step instructions for writing the simulation program, which will be saved under pkt_first_anim.cc in the ns-allinone-3.36/ns-3.36/scratch/ folder.
In this section, we will simulate a four-node CSMA LAN and visualize its simulation:
- First, import all necessary ns-3 packages (
core,network,internet,applications, andflow-monitor). Besides this, as we want to simulate a CSMA LAN and visualize its execution, thecsmaandnetanimmodules are imported:#include "ns3/csma-module.h" #include "ns3/netanim-module.h"
- In ns-3, the actual simulation execution starts with the
main()function. We write the following relevant code inmain():- As per the topology diagram given in our simulation activity, we start with first creating four hosts as four nodes using
NodeContainer:
  NodeContainer nodes;
  nodes.Create (4);
- Then, we create and configure the CSMA channel as per our requirements (5 Mbps speed, 6,560 ns delay) using
CsmaHelper:
CsmaHelper csma; csma.SetChannelAttribute ("DataRate", StringValue ("5Mbps")); csma.SetChannelAttribute ("Delay", TimeValue (NanoSeconds (6560)));- Next, install the CSMA protocol on the nodes, which connects them using the CSMA channel. As a result, it returns four devices to
NetDeviceContainerdevices: the first device is the Node-0 NIC, the second device is the Node-1 NIC, and so on:
  NetDeviceContainer devices;
  devices = csma.Install (nodes);
- Now, we install TCP/IP on the nodes. Then, we configure the IP addresses for the
NetDeviceContainerdevices under the192.168.1.0network ID. As a result, Node-0 gets192.168.1.1and Node-3 gets192.168.1.4:
InternetStackHelper stack; stack.Install (nodes); Ipv4AddressHelper address; address.SetBase ("192.168.1.0", "255.255.255.0"); Ipv4InterfaceContainer interfaces = address.Assign (devices); - As per the topology diagram given in our simulation activity, we start with first creating four hosts as four nodes using
- Create the ns-3 traffic applications and install them as per the simulation topology:
- First, create a UDP echo server application and install it on Node-3. Then, configure its start and stop timings:
  uint64_t port = 9;
  UdpEchoServerHelper echoServer (port);
  ApplicationContainer serverApps = echoServer.Install (nodes.Get (3));
  serverApps.Start (Seconds (1.0));
  serverApps.Stop (Seconds (10.0));
- Next, create a UDP echo client application and install it on Node-0. Configure its traffic characteristics (
MaxPackets=1000,Interval=0.1, andPacketSize=1024), and set start and stop timings based onMaxPackets:
UdpEchoClientHelper echoClient (interfaces.GetAddress (3), port); echoClient.SetAttribute ("MaxPackets", UintegerValue (1000)); echoClient.SetAttribute ("Interval", TimeValue (Seconds (0.1))); echoClient.SetAttribute ("PacketSize", UintegerValue (1024)); ApplicationContainer clientApps = echoClient.Install (nodes.Get (0)); clientApps.Start (Seconds (2.0)); clientApps.Stop (Seconds (10.0)); - Install
FlowMonitoron all nodes to collect flow-level statistics. Hence, at the end of the simulation, we can view each traffic flow’s throughput, delay, jitter, and packet loss:Ptr<FlowMonitor> flowmon; FlowMonitorHelper flowmonHelper; flowmon = flowmonHelper.InstallAll ();
- Configure the animation interface. At the end of the simulation execution, an animation XML file called
first_animation_demo.xmlwill be generated. The XML file can be viewed using NetAnim to visualize the simulation execution:- We want to name Node-0 as a UDP echo client and Node-3 as a UDP echo server in the visualization:
AnimationInterface anim ("first_animation_demo.xml"); anim.UpdateNodeDescription (3, "UDP Echo Server"); anim.UpdateNodeDescription (0, "UDP Echo Client");- During the simulation execution, we want to visualize the various protocol packets exchanged:
anim.EnablePacketMetadata ();
- At end of the simulation, we want to visualize routing tables configured on various nodes using NetAnim:
anim.EnableIpv4RouteTracking ("firstanim_routetable.xml", Seconds (0), Seconds (2), Seconds (0.25));- At end of the simulation, we want to visualize various packet counter values of various nodes using NetAnim:
  anim.EnableIpv4L3ProtocolCounters (Seconds (0), Seconds (10));
  anim.EnableQueueCounters (Seconds (0), Seconds (10));
  Simulator::Stop (Seconds(11.0));
  Simulator::Run ();
- At end of the simulation, we want to view all flows’ flow statistics, such as throughput, delay, jitter, and packet loss:
  flowmon->SerializeToXmlFile ("firstanim_flowmetrics.xml", true, true);
  Simulator::Destroy ();
Now, you can execute your simulation program using the following command:
$ ./ns3 run scratch/pkt_first_anim
It generates 3 XML files such as first_animation_demo.xml, firstanim_routetable.xml, and firstanim_flowmetrics.xml
Playing your simulation using NetAnim
Now, play your simulation using NetAnim and do the following - After opening NetAnim, open first_animation_demo.xml to visualize the simulation. While playing this simulation using NetAnim, you can see (refer to Figure 1.20) the first exchange of Address Resolution Protocol (ARP) packets to discover the link addresses (MAC) of the nodes, then the actual UDP traffic packet exchange begins among the nodes:
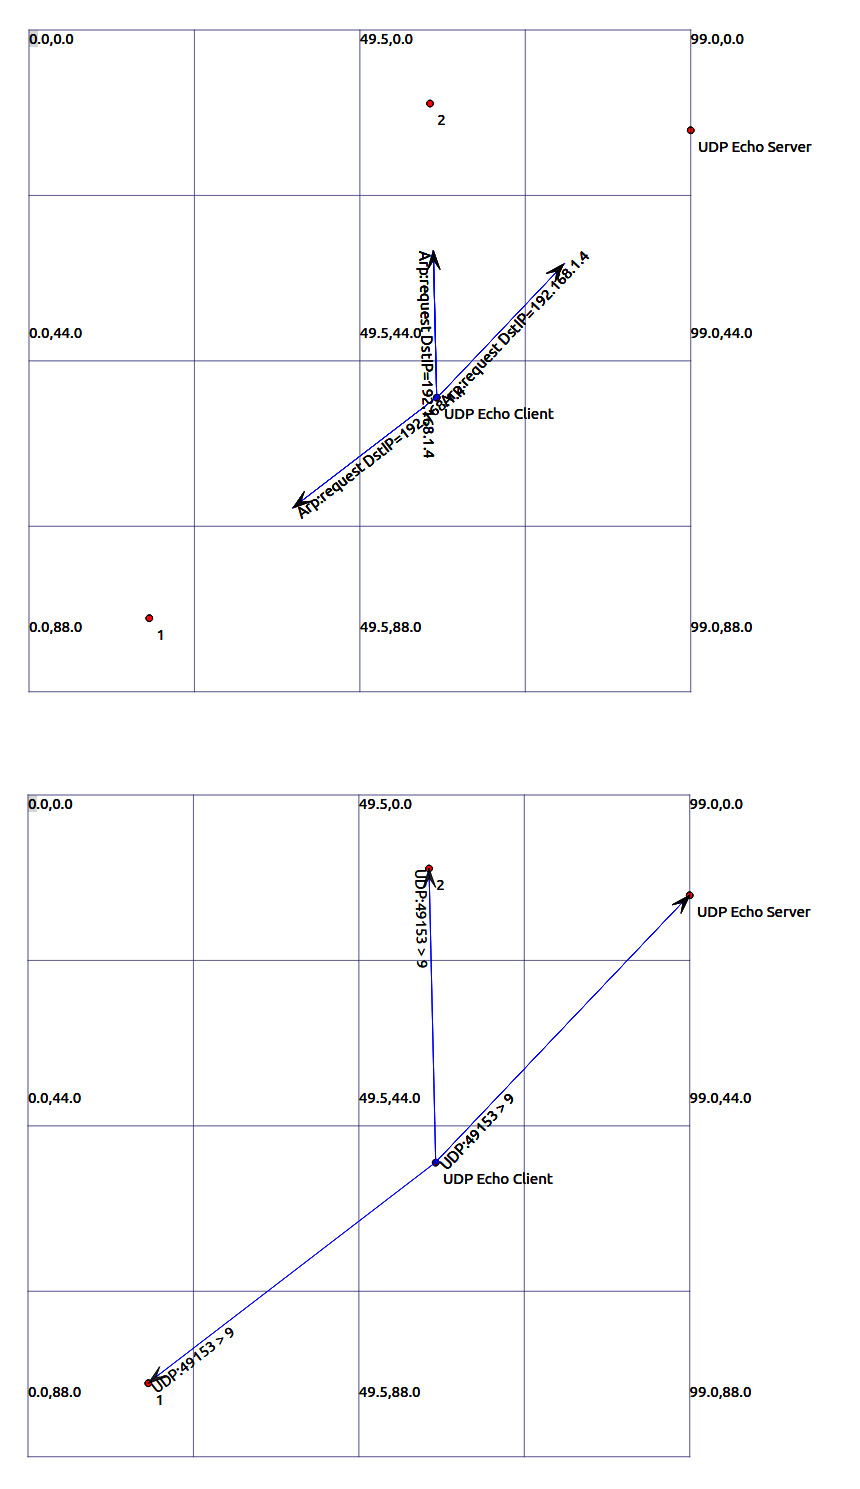
Figure 1.20 – Visualize ARP packets and UDP packets using NetAnim
Important note
If you comment anim.EnablePacketMetadata() in the code or disable the M option from the side panel, you will not see any packets exchanged during the simulation visualization. At the end of the simulation, if you want to see packet exchanges happening between various nodes, you can do it using the Packets tab options. We’ll explore the Packets tab and its options in the following subsection.
Inspecting a variety of traffic packets under the NetAnim Packets tab
Under the Packets tab (refer to Figure 1.21), by using the Show Nodes option and selecting the packet type, it is possible to view various packets exchanged between various nodes:

Figure 1.21 – The NetAnim Packets tab options
For example, we can observe the exchange of ARP packets between Node-0 and Node-3 by doing the following (refer to Figure 1.22). Type 0 : : : 3 in Show Nodes, tick Arp, then click on Submit:

Figure 1.22 – Select the Arp option to view ARP packets exchange
We can observe the following chart (refer to Figure 1.23) showing the exchange of ARP packets between Node-0 and Node-3:

Figure 1.23 – ARP packets exchange between Node-0 and Node-3 shown as a sequence diagram
We can also observe the exchange of ARP packets between Node-0 and Node-3 in a table format (refer to Figure 1.24) in time series rows:
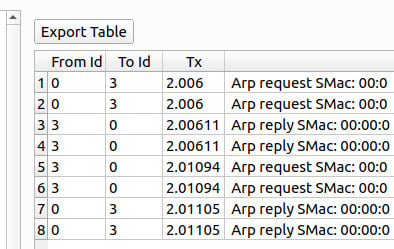
Figure 1.24 – ARP packets exchange shown as a table
Similarly, you can try observing Ethernet, IP, and UDP packet exchanges between various nodes at simulation time. Next, we will explore the Stats tab for visualizing routing tables, various counter values, and flow statistics.
Inspecting simulation statistics under the NetAnim Stats tab
In order to inspect network node configuration details such as IP and MAC, flow-level stats, routing tables, and counters, we can use the Stats tab (refer to Figure 1.25) and its following options:

Figure 1.25 – The NetAnim Stats tab options
The first option is IP-MAC. By default, IP-MAC details (refer to Figure 1.26) can be viewed without any lines of code in your simulation program:

Figure 1.26 – The NetAnim IP-MAC menu window
As we selected the All option, it is displaying all the nodes’ IP and MAC details, as shown in Figure 1.27. You can try selecting a particular node ID:

Figure 1.27 – The ns-3 nodes’ IP and MAC details
We also have the Routing option. To view routing tables, open firstanim_routetable.xml, which was generated by your simulation program. Now, we can view the routing tables of all nodes or individual nodes by clicking on the node numbers displayed on the side panel shown in Figure 1.28:

Figure 1.28 – The NetAnim Routing menu window
We selected the All option to display all nodes’ routing tables, as shown in Figure 1.29:
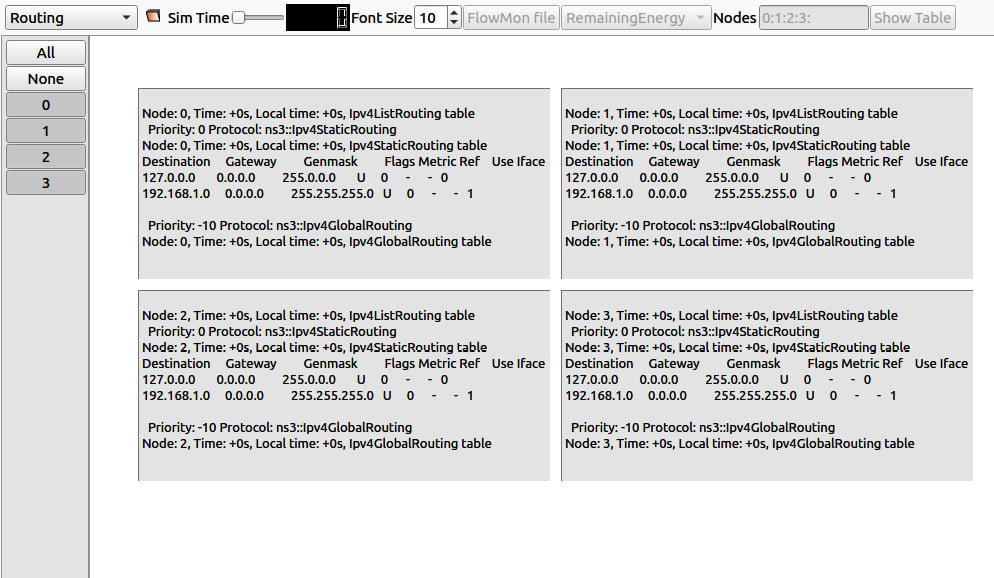
Figure 1.29 – Our simulation ns-3 nodes’ routing table details
Then, we have the Flow-monitor option. From the Stats tab, select Flow-monitor (refer to Figure 1.30). Next, click the FlowMon file button and open firstanim_flowmetrics.xml, generated by your simulation program:

Figure 1.30 – The NetAnim Flow-monitor window
Now, we can view the flow-level stats of all nodes (refer to Figure 1.31) or individual nodes by clicking on the node numbers displayed on the side panel. We selected the ALL option to show all flows’ statistics:
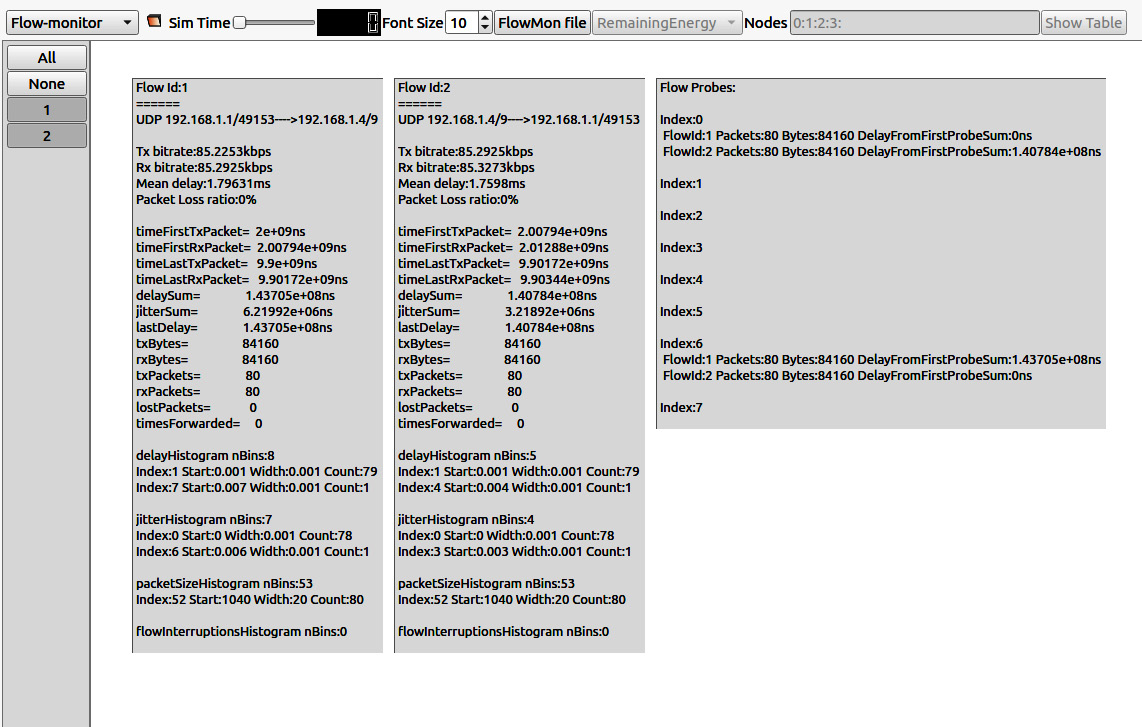
Figure 1.31 – Our simulation flow-level statistics
We also have the Counter Tables option. We can check the counter value of various nodes by selecting the Counter Tables menu item under the Stats menu list.
After selecting Counter Tables, we can select from the Ipv4 Tx, Ipv4 Rx, Ipv4 Drop, Enqueue, Dequeue, and Queue Drop options next to the FlowMon file option (refer to Figure 1.32):

Figure 1.32 – The NetAnim Counter Tables window
For example, to show IPv4 packet drops on various nodes, you can select the Ipv4 Drop option and view the result (refer to Figure 1.33) in table or chart format by clicking on the show table or show chart button:
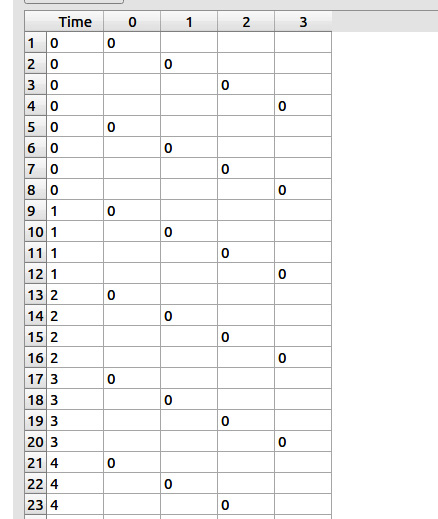
Figure 1.33 – Our simulation nodes’ IPv4 packet drop counter table
Well done! After practicing your first hands-on activity, you are ready to explore ns-3's more interesting features.


