The Diagnostics Tools feature of Visual Studio provides you with historical information about your application in a debugging session. Along with Visual Studio 2013, Microsoft first introduced the Performance and Diagnostics hub feature which changed over time and was relaunched as Diagnostics Tools in Visual Studio 2015 with more limited options than the version currently available in Visual Studio 2017.
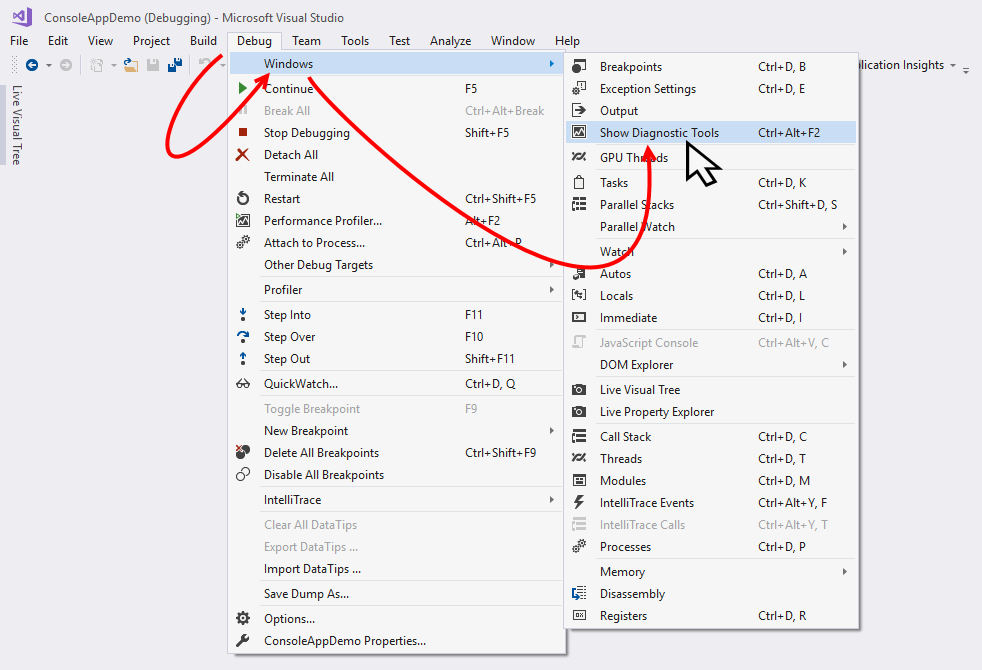
When you start a debugging session, the Diagnostics Tools window will automatically launch and show side-by-side of your code window. In case it is unavailable, you can launch it from the Visual Studio Debug | Windows | Show Diagnostics Tools menu or alternatively you can press the keyboard shortcut Ctrl + Alt + F2:

The window shows you detailed historical information about your application, PerfTips, in the events graph and events table...


