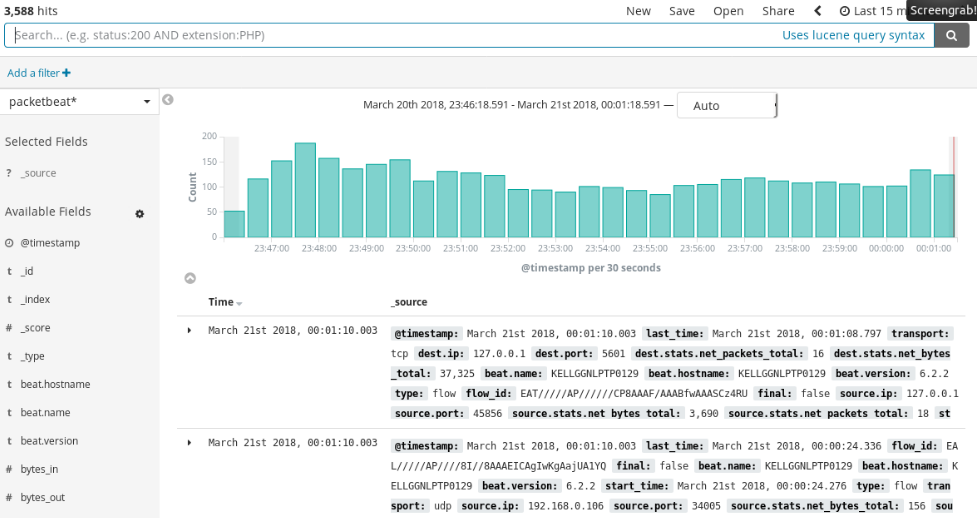
We have configured the Packetbeat data in Kibana, so now we can explore it using the Discover tab. After clicking on the Discover link on the left-hand side menu, we will see the following screen:

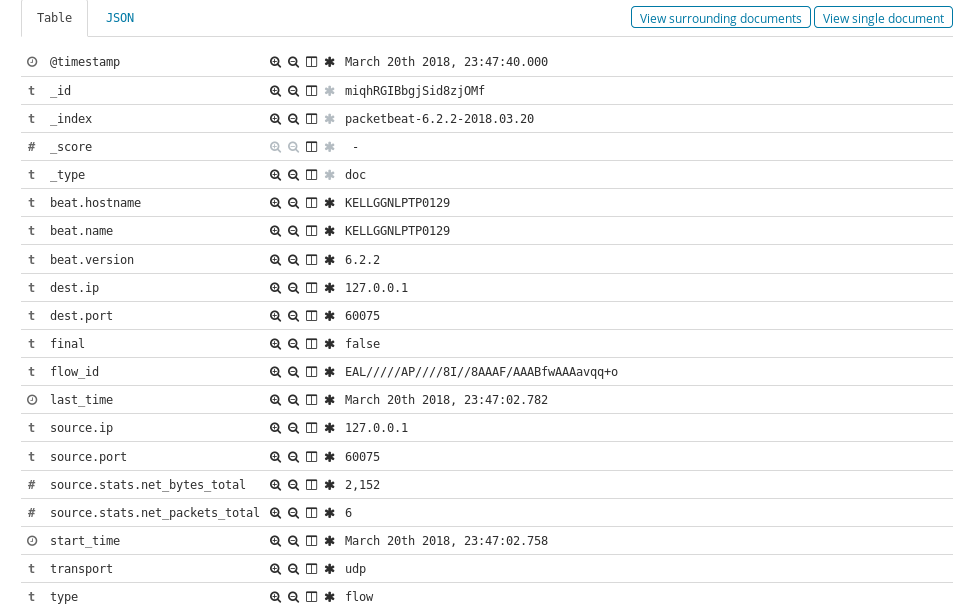
Here, we can see that the histogram is full since there have been regular entries of packet data into the Elasticsearch index. We can explore the histogram by clicking on any of the bars, which will open a detailed bar of that duration. We can drill down by clicking on the bar on the histogram. In the following screenshot, we can see a list of documents regarding the histogram with the packet data. We can expand any document, which opens a tabular view of the data:

Here, we can see each field with the data in tabular form. We can directly apply the filters by clicking on icons in front of the field names. We can convert this tabular...


