


The Tableau paradigm
The unique and exciting experience of working with data in Tableau is a result of VizQL (Visual Query Language).
VizQL was developed as a Stanford University research project, focusing on the natural ways that humans visually perceive the world and how that could be applied to data visualization. We naturally perceive differences in size, shape, spatial location, and color. VizQL allows Tableau to translate your actions, as you drag and drop fields of data in a visual environment, into a query language that defines how the data encodes those visual elements. You will never need to read, write, or debug VizQL. As you drag and drop fields onto various shelves defining size, color, shape, and spatial location, Tableau will generate the VizQL behind the scenes. This allows you to focus on visualizing data, not writing code!
One of the benefits of VizQL is that it provides a common way of describing how the arrangement of various fields in a view defines a query related to the data. This common baseline can then be translated into numerous flavors of SQL, MDX, and Tableau Query Language (TQL, used for extracted data). Tableau will automatically perform the translation of VizQL into a native query to be run by the source data engine.
In its simplest form, the Tableau paradigm of working with data looks like the following diagram:
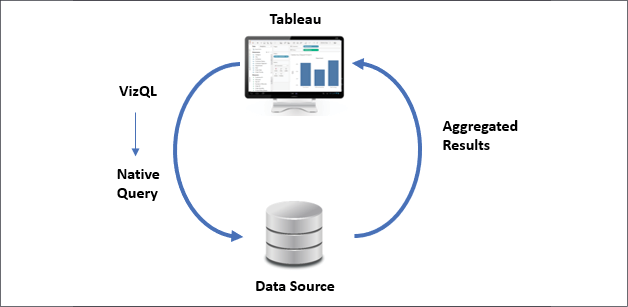
Figure 2.1: The basic Tableau paradigm for working with data
Let's look at how this paradigm works in a practical example.
A simple example
Open the Chapter 02 Starter.twbx workbook located in the \Learning Tableau\Chapter 02 directory and navigate to the Tableau Paradigm sheet. That view was created by dropping the Region dimension on Columns and the Sales measure on Rows. Here is a screenshot:
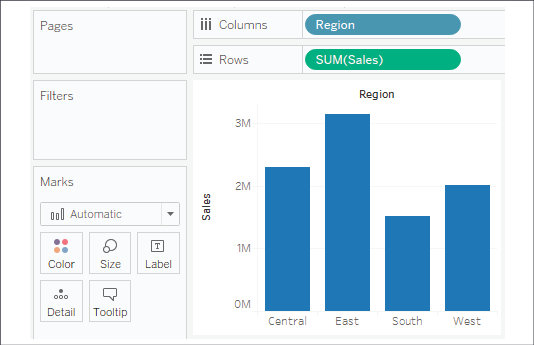
Figure 2.2: This bar chart is the result of a query that returned four aggregate rows of data
The view is defined by two fields. Region is the only dimension, which means it defines the level of detail in the view and slices the measure so that there will be a bar per region. Sales is used as a measure aggregated by summing each sale within each region. (Notice also that Region is discrete, resulting in column headers while Sales is continuous, resulting in an axis.)
For the purpose of this example (although the principle is applicable to any data source), let's say you were connected live to a SQL Server database with the Superstore data stored in a table. When you first create the preceding screenshot, Tableau generates a VizQL script, which is translated into an SQL script and sent to the SQL Server. The SQL Server database engine evaluates the query and returns aggregated results to Tableau, which are then rendered visually.
The entire process would look something like the following diagram in Tableau's paradigm:
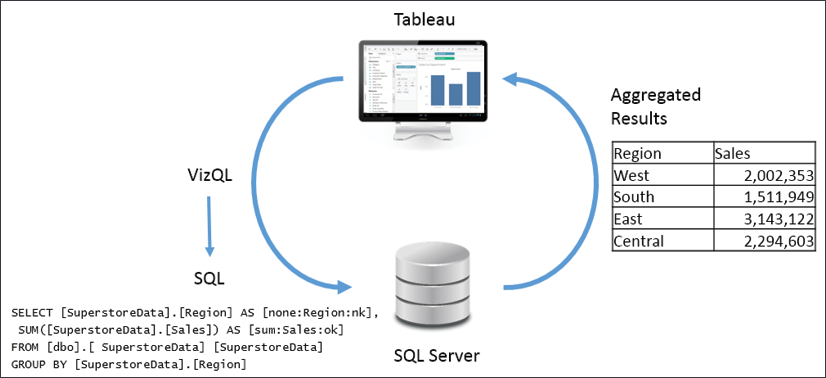
Figure 2.3: Tableau generated the bar chart in the previous image using a paradigm like this
There may have been hundreds, thousands, or even millions of rows of sales data in SQL Server. However, when SQL Server processes the query, it returns aggregate results. In this case, SQL Server returns only four aggregate rows of data to Tableau—one row for each region.
On occasion, a database administrator may want to find out what scripts are running against a certain database to debug performance issues or to determine more efficient indexing or data structures. Many databases supply profiling utilities or log execution of queries. In addition, you can find SQL or MDX generated by Tableau in the logs located in the My Tableau Repository\Logs directory.
You may also use Tableau's built-in Performance Recorder to locate the queries that have been executed. From the top menu, select Help | Settings and Performance | Start Performance Recording, then interact with a view, and finally, stop the recording from the menu. Tableau will open a dashboard that will allow you to see tasks, performance, and queries that were executed during the recording session.
To see the aggregate data that Tableau used to draw the view, press Ctrl + A to select all the bars, and then right-click one of them and select View Data.
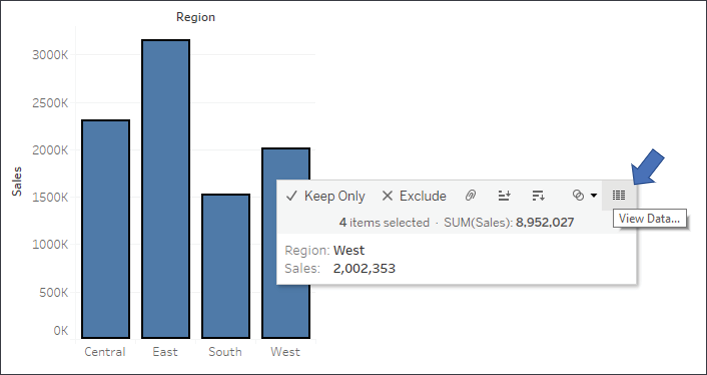
Figure 2.4: Use the View Data tooltip option to see a summary or underlying data for a mark
This will reveal a View Data window:
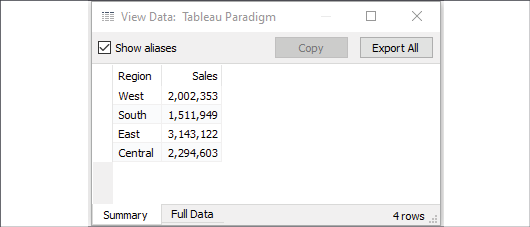
Figure 2.5: The Summary tab displays the aggregate data Tableau used to render each mark in the view
The View Data screen allows you to observe the data in the view. The Summary tab displays the aggregate-level data that was used to render the view. The Sales values here are the sum of sales for each region. When you click the Full Data (previously named Underlying) tab, Tableau will query the data source to retrieve all the records that make up the aggregate records. In this case, there are 9,426 underlying records, as indicated on the status bar in the lower-right corner of the following screenshot:
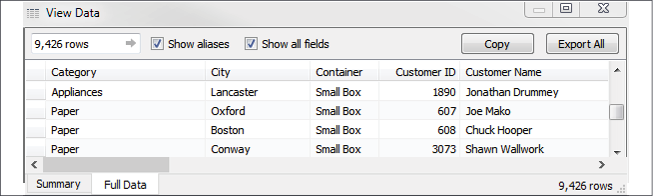
Figure 2.6: The Full Data tab reveals the row-level data in the database
Tableau did not need 9,426 records to draw the view and did not request them from the data source until the Full Data data tab was clicked.
Database engines are optimized to perform aggregations on data. Typically, these database engines are also located on powerful servers. Tableau leverages the optimization and power of the underlying data source. In this way, Tableau can visualize massive datasets with relatively little local processing of the data.
Additionally, Tableau will only query the data source when you make changes requiring a new query or a view refresh. Otherwise, it will use the aggregate results stored in a local cache, as illustrated here:
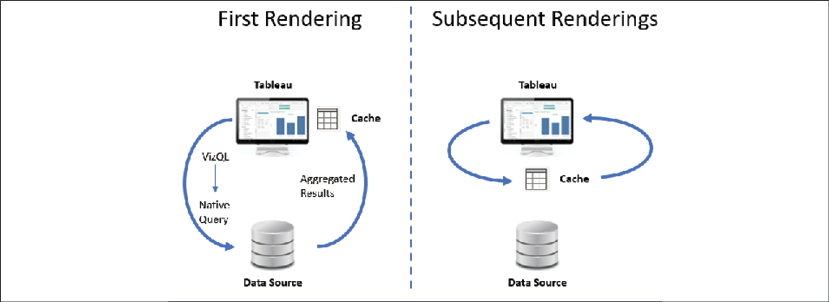
Figure 2.7: The first rendering with a given set of fields queries the data source directly. Subsequent renderings will query the cache, even if the same fields are re-arranged in the view
In the preceding example, the query with Region as a dimension and the sum of Sales as a measure will only be issued once to the data source. When the four rows of aggregated results are returned, they are stored in the cache. After the initial rendering, if you were to move Region to another visual encoding shelf, such as color, or Sales to a different visual encoding shelf, such as size, then Tableau will retrieve the aggregated rows from the cache and simply re-render the view.
You can force Tableau to bypass the cache and refresh the data from a data source by pressing F5 or selecting your data source from the Data menu and selecting Refresh. Do this any time you want a view to reflect the most recent changes in a live data source.
If you were to introduce new fields into the view that did not have cached results, Tableau would send a new query to the data source, retrieve the aggregated results, and add those results to the cache.


