Before going into detail about Neo4j, let's first have a look at the existing database models. We'll then focus on the most famous one, the relational model, and learn how to migrate from SQL to a graph database model.
Database models
Think about water: depending on the end goal, you will not use the same container. If you want to drink, you might use a glass of water but if you want to have a bath, you will probably choose another one. The choice of container will be different in each scenario. The problem is similar for data: without a proper container, there is nothing we can do with it and we need a proper container depending on the situation, which will not only store data but also contribute to solve the problem we have. This data container is the database.
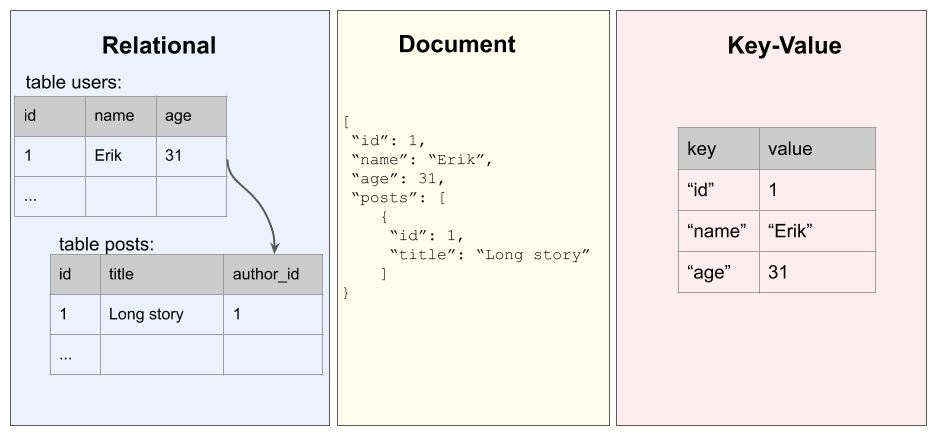
Drawing an exhaustive list of database types on the market is not impossible but would go far beyond the scope of this book. However, I want to give some examples of the most popular ones, so that you can see where graph databases stand in the big picture:
- Relational databases: They are by far the most well known type of database. From SQLite to MySQL or PostgreSQL, they use a common query language, called Structured Query Language (SQL), with some variations among the different implementations. They are well established and allow a clear structure of the data. However, they suffer from performance issues when the data grows and are surprisingly not that good at managing complex relationships, since the relationships require many joins between tables.
- Document-oriented databases: Document-oriented databases, part of the NoSQL (Not Only SQL) era, have gained increasing interest during the last few years. Contrary to relational databases, they can manage flexible data models and are known for better scaling with a large amount of data. Examples of NoSQL databases include MongoDB and Cassandra, but you can find many more on the market.
- Key-value stores: Redis, RocksDB, and Amazon DynamoDB are examples of key-value databases. They are very simple and known to be very fast, but are not well suited to store complex data.
Here is how the different databases can be viewed in a figurative representation:

Graph databases try to bring the best of each world into a single place by being quite simple to use, flexible, and very performant when it comes to relationships.
SQL and joins
Let's briefly focus on relational databases. Imagine we want to create a Question and Answer website (similar to the invaluable Stack Overflow). The requirements are the following:
- Users should be able to log in.
- Once logged in, users can post questions.
- Users can post answers to existing questions.
- Questions need to have tags to better identify which question is relevant for which user.
As developers or data scientists, who are used to SQL, we would then naturally start thinking in terms of tables. Which table(s) should I create to store this data? Well, first we will look for entities that seem to be the core of the business. In this QA website, we can identify the following:
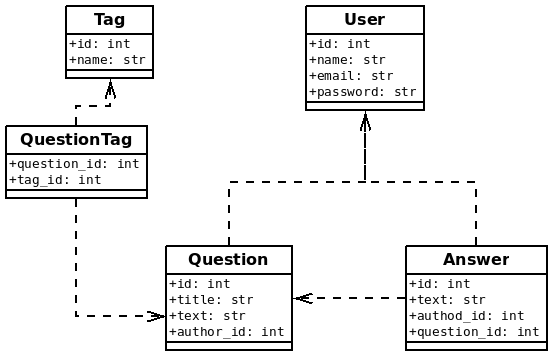
- Users, with attributes: ID, name, email, password
- Questions: ID, title, text
- Answers: ID, text
- Tags: ID, text
With those entities, we now need to create the relationships between them. To do so, we can use foreign keys. For instance, the question has been asked by a given user, so we can just add a new column to the question table, author_id, referencing the user table. The same applies for the answers: they are written by a given user, so we add an author_id column to the Answer table:

It becomes more complicated for tags, since one question can have multiple tags and a single tag can be assigned to many questions. We are in the many-to-many relationship type, which requires adding a join table, a table that is just there to remember that kind of relationship. This is the case of the QuestionTag table in the preceding diagram; it just holds the relationship between tags and questions.
It's all about relationships
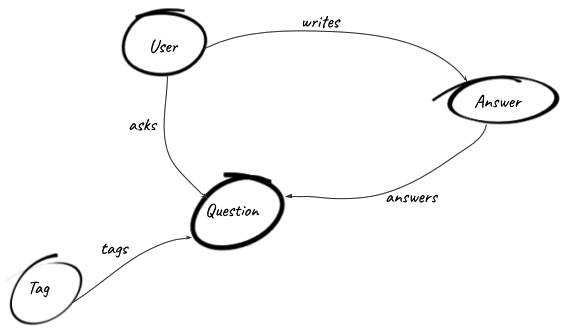
The previous exercise probably looks easy to you, because you have followed lectures or tutorials about SQL and use it pretty often in your daily work. But let's be honest, the first time you face a problem and have to create the data model that will allow you to solve it, you will probably draw something that looks like the diagram in the following image, right?

This is one of the powers of graph databases:
Neo4j, as a graph database, allows you to create vertices, or nodes, and the relationships connecting them. The next section summarizes how the different entities in the Neo4j ecosystem are related to each other and how we can structure our data in a graph.


