Search icon CANCEL
Subscription
0
Cart icon
Your Cart (0 item)
Close icon
You have no products in your basket yet
Arrow left icon
Explore Products
Best Sellers
New Releases
Books
Videos
Audiobooks
Learning Hub
Free Learning
Arrow right icon
Arrow up icon
GO TO TOP
Big Data Analytics with Hadoop 3

You're reading from   Big Data Analytics with Hadoop 3 Build highly effective analytics solutions to gain valuable insight into your big data

Arrow left icon
Product type Paperback
Published in May 2018
Publisher Packt
ISBN-13 9781788628846
Length 482 pages
Edition 1st Edition
Languages
Tools
Concepts
Arrow right icon
Author (1):
Arrow left icon
Sridhar Alla Sridhar Alla
Author Profile Icon Sridhar Alla
Sridhar Alla
Arrow right icon
View More author details
Toc

Table of Contents (13) Chapters Close

Preface 1. Introduction to Hadoop FREE CHAPTER 2. Overview of Big Data Analytics 3. Big Data Processing with MapReduce 4. Scientific Computing and Big Data Analysis with Python and Hadoop 5. Statistical Big Data Computing with R and Hadoop 6. Batch Analytics with Apache Spark 7. Real-Time Analytics with Apache Spark 8. Batch Analytics with Apache Flink 9. Stream Processing with Apache Flink 10. Visualizing Big Data 11. Introduction to Cloud Computing 12. Using Amazon Web Services

Using the Flink cluster UI


Using the Flink cluster UI, you can understand and monitor what's running in your cluster and dig deeply into various jobs and tasks. You can monitor the job statuses, cancel jobs, or debug any problems with the jobs. By looking at logs, you can also diagnose problems with your code, and fix them.

The following is a list of Completed Jobs:

You can drill down into any particular job to see more details about the job's execution:
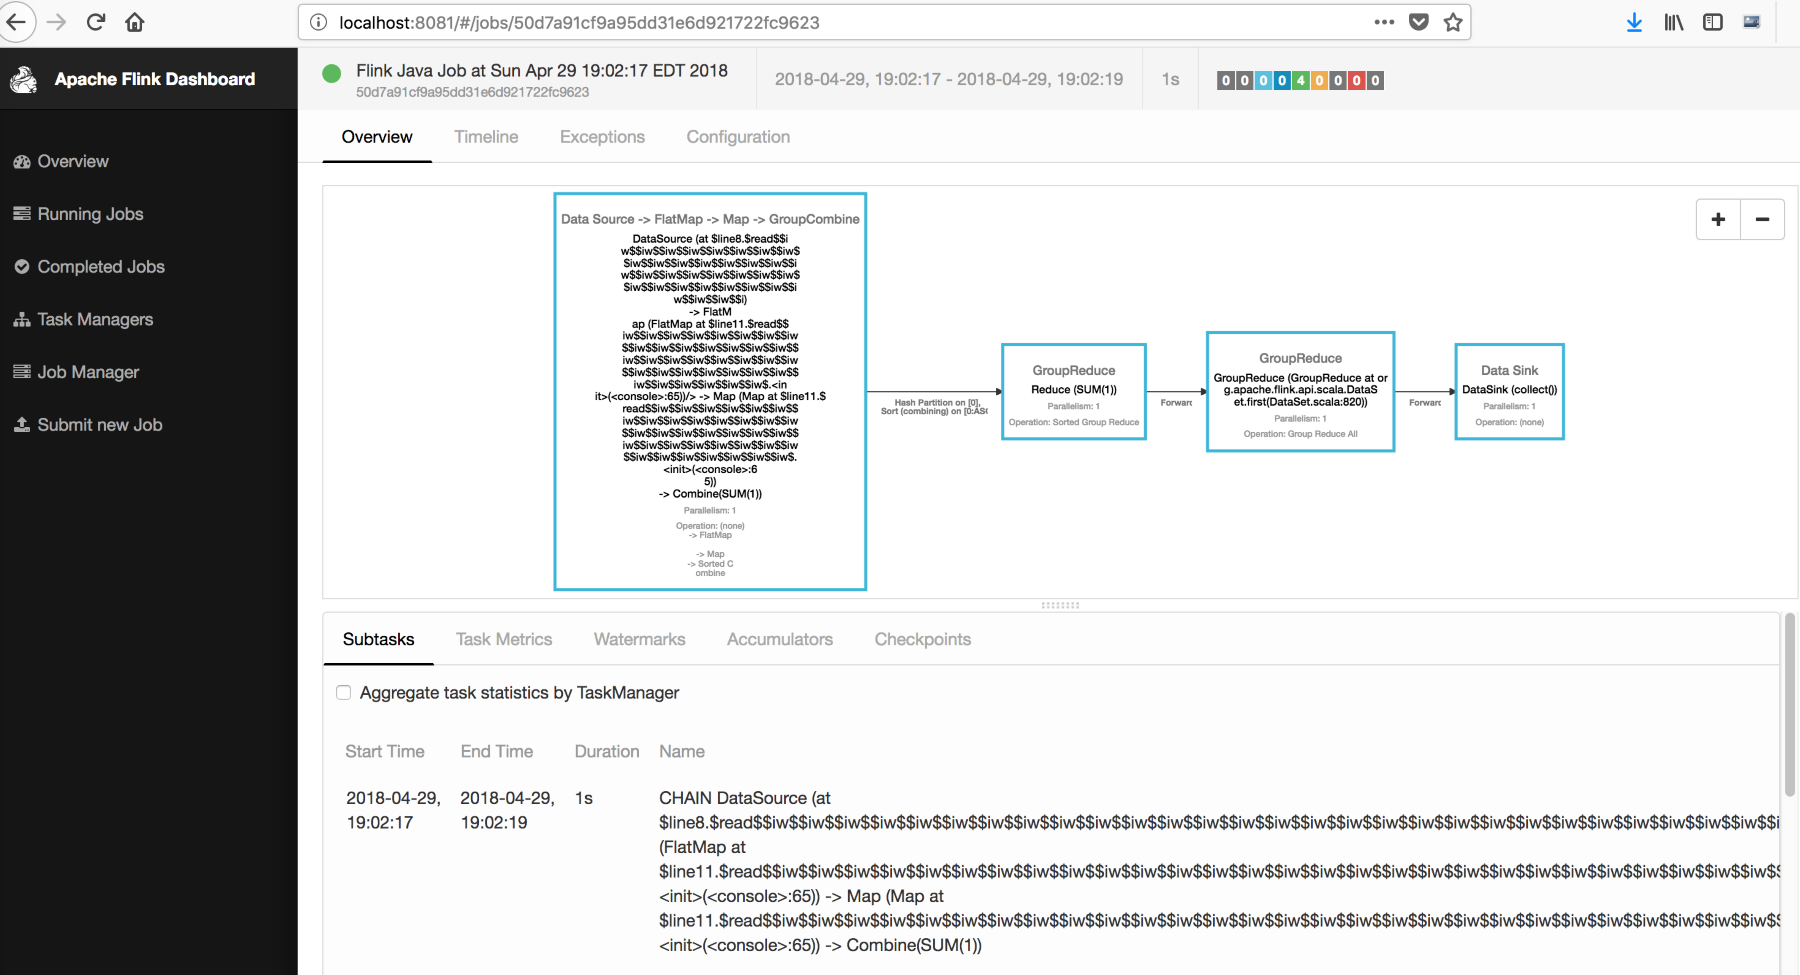
Figure: Drilling down a particular job to see job's execution

You can look at the Timeline of the job to get more details:

Figure: Screenshot to see Timeline of a job

The following screenshot shows the Task Managers tab, showing all of the task managers. This helps you understand the number and status of the task managers:

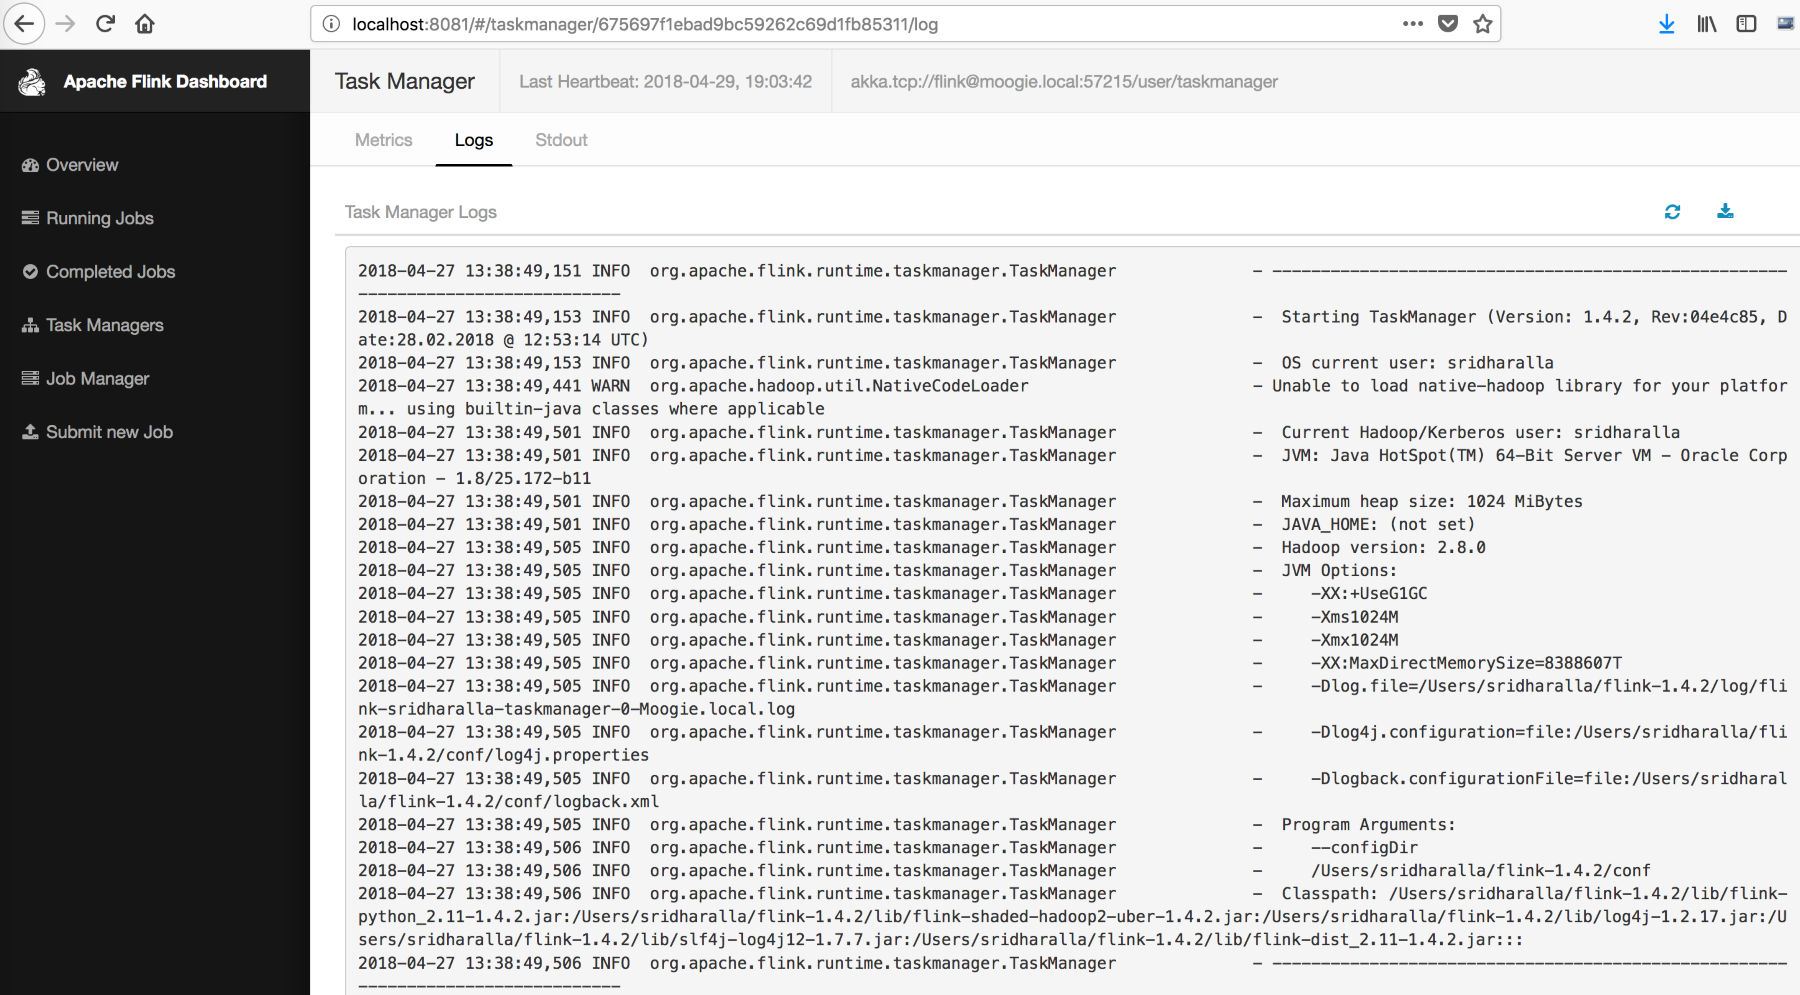
You can also check the Logs, as shown in the following screenshot:
The Metrics tab gives you details of the memory and CPU resources:
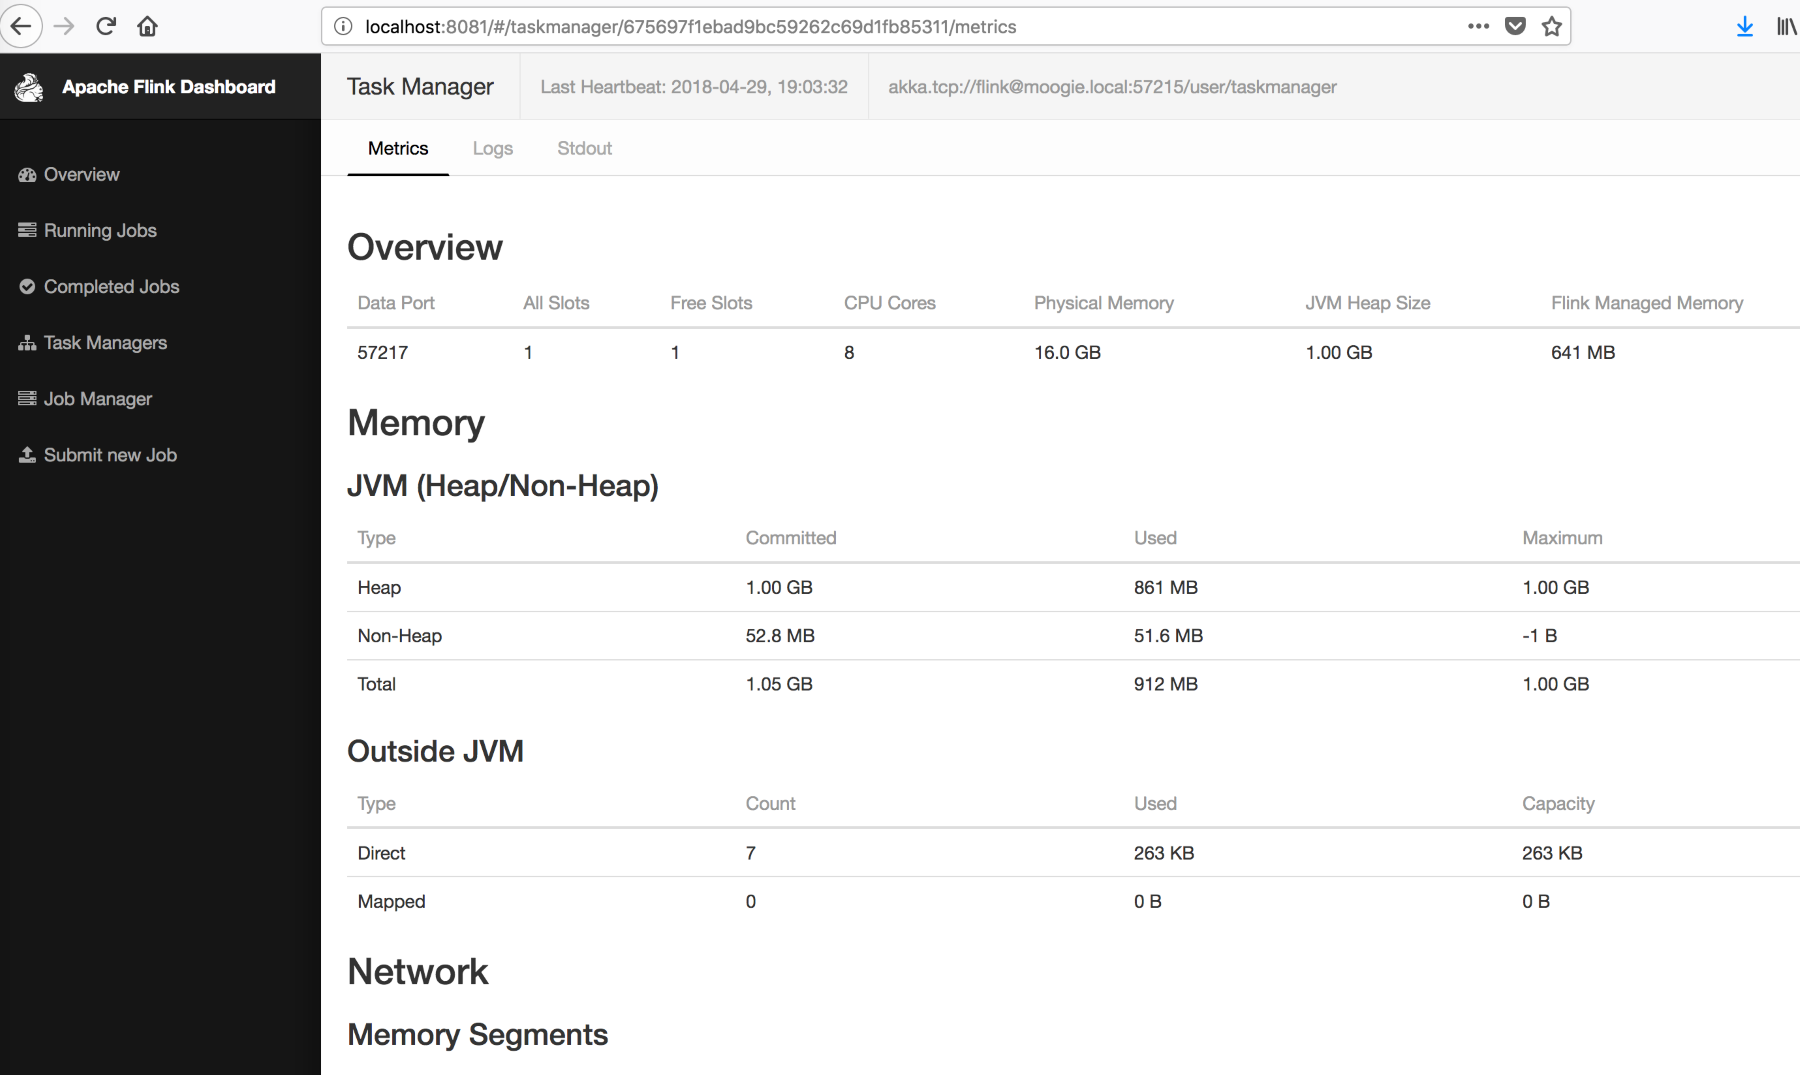
Figure: Screenshot showing details of the memory and CPU resources in Metrics tab

You can also...

lock icon The rest of the chapter is locked
Register for a free Packt account to unlock a world of extra content!
A free Packt account unlocks extra newsletters, articles, discounted offers, and much more. Start advancing your knowledge today.
Unlock this book and the full library FREE for 7 days
Get unlimited access to 7000+ expert-authored eBooks and videos courses covering every tech area you can think of
Renews at $19.99/month. Cancel anytime
Banner background image