Search icon CANCEL
Arrow left icon
Explore Products
Best Sellers
New Releases
Books
Videos
Audiobooks
Learning Hub
Conferences
Free Learning
Arrow right icon
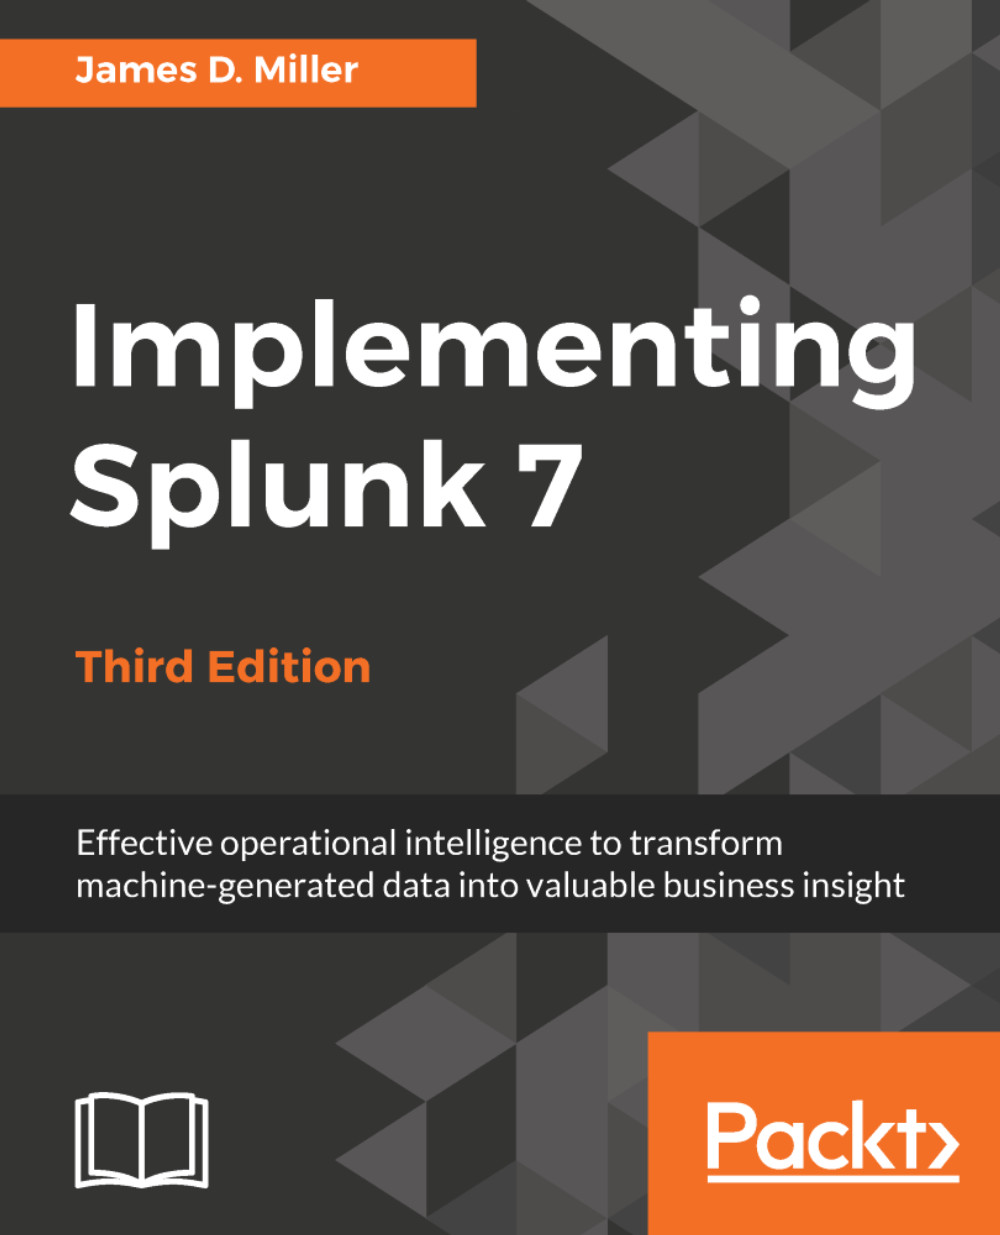
Implementing Splunk 7, Third Edition

Implementing Splunk 7, Third Edition: Effective operational intelligence to transform machine-generated data into valuable business insight , Third Edition

eBook
$43.99
Paperback
$54.99
Subscription
Free Trial
Renews at $19.99p/m

What do you get with a Packt Subscription?

Free for first 7 days. $19.99 p/m after that. Cancel any time!
Product feature icon Unlimited ad-free access to the largest independent learning library in tech. Access this title and thousands more!
Product feature icon 50+ new titles added per month, including many first-to-market concepts and exclusive early access to books as they are being written.
Product feature icon Innovative learning tools, including AI book assistants, code context explainers, and text-to-speech.
Product feature icon Thousands of reference materials covering every tech concept you need to stay up to date.
Subscribe now
View plans & pricing
Table of content icon View table of contents Preview book icon Preview Book

Implementing Splunk 7, Third Edition

The Splunk Interface

This is the third edition of this book! Splunk has continued to grow in popularity since our original publication and each new release of the product proves to be enthusiastically consumed by the industry. The content of each chapter within this edition has been reviewed and updated for Splunk version 7.0, with new sections added to cover several new features now available in version 7.0. In addition, we have two new chapters, one covering Splunk's latest machine learning toolkit (MLT) and another discussing practical proven-practice recommendations. So, even if you have an earlier edition of this book (thank you!), it's worthwhile picking up this edition.

Let's begin!

This chapter will walk you through the most common elements in the Splunk interface, and will touch upon concepts that are covered in greater detail in later chapters. You may want to dive right into them, but an overview of the user interface elements might save you some frustration later. We will cover the following topics in this chapter:

  • Logging in and app selection
  • A detailed explanation of the search interface widgets
  • A quick overview of the admin interface

Logging in to Splunk

The Splunk GUI (Splunk is also accessible through its command-line interface (CLI) and REST API) is web-based, which means that no client needs to be installed. Newer browsers with fast JavaScript engines, such as Chrome, Firefox, and Safari, work better with the interface. As of Splunk Version 6.2.0 (and version 7.0 is no different), no browser extensions are required.

The default port (which can be changed) for a Splunk installation is still 8000. The address will look like http://mysplunkserver:8000 or http://mysplunkserver.mycompany.com:8000:

The Splunk interface

If you have installed Splunk on your local machine, the address can be some variant of http://localhost:8000, http://127.0.0.1:8000, http://machinename:8000, or http://machinename.local:8000.

Once you determine the address, the first page you will see is the login screen. The default username is admin with the password changeme. The first time you log in, you will be prompted to change the password for the admin user. It is a good idea to change this password to prevent unwanted changes to your deployment.

By default, accounts are configured and stored within Splunk. Authentication can be configured to use another system, for instance, Lightweight Directory Access Protocol (LDAP). By default, Splunk authenticates locally. If LDAP is set up, the order is as follows: LDAP / Local.

The home app

After logging in, the default app is the Launcher app (some refer to it as Home). This app is a launching pad for apps and tutorials.

Note that with your first login, Splunk will present a popup displaying Help us improve Splunk software that will ask you permission (Splunk) to collect information about your Splunk usage. It is up to you how to respond.

In earlier versions of Splunk, the Welcome tab provided two important shortcuts, Add data and Launch search app. In version 6.2.0, the Home app was divided into distinct areas or panes that provided easy access to Explore Splunk Enterprise (Add Data, Splunk Apps, Splunk Docs, and Splunk Answers) as well as Apps (the app management page), Search & Reporting (the link to the Search app), and an area where you can set your default dashboard (choose a home dashboard).

In version 7.0, the main page has not been changed very much, although you may notice some difference in the graphics. But the general layout remains the same, with the same panes and access to the same functionalities.

We'll cover apps and dashboards in later chapters of this book:

The Explore Splunk Enterprise pane shows the following links:

  • Product Tours (a change in 7.0): When you click here, you can select a specific tour for your review (Add Data Tour, Search Tour and Dashboards Tour).
Note: for first-timers, when you first click on any of the following links, Splunk will ask whether you'd like to pause and view a tour based on the link you chose. Of course, you always have the opportunity to go back at any time to the Product Tours link to review a tour.
  • Add Data: This links Add Data to the Splunk page. This interface is a great start for getting local data flowing into Splunk (making it available to Splunk users). The Preview data interface takes an enormous amount of complexity out of configuring dates and line breaking. We won't go through those interfaces here, but we will go through the configuration files that these wizards produce in Chapter 11, Configuring Splunk.

  • Splunk Apps: This allows you to find and install more apps from the Splunk Apps Marketplace (https://splunkbase.splunk.com). This marketplace is a useful resource where Splunk users and employees post Splunk apps, mostly free but some premium ones as well. Note that you will need to have a splunk.com user ID.

  • Splunk Docs: This is one of your links to the wide amount of Splunk documentation available, specifically https://answers.splunk.com, to come on board with the Splunk community on Splunkbase (https://splunkbase.splunk.com/) and get the best out of your Splunk deployment. In addition, this is where you can access http://docs.splunk.com/Documentation/Splunk for the very latest updates to documentation on (almost) any version of Splunk.

The Apps section shows the apps that have GUI elements on your instance of Splunk. App is an overloaded term in Splunk. An app doesn't necessarily have a GUI; it is simply a collection of configurations wrapped into a directory structure that means something to Splunk. We will discuss apps in a more detailed manner in Chapter 8, Working with Apps.

Search & Reporting is the link to the Splunk Search & Reporting app:

Beneath the Search & Reporting link, Splunk provides an outline that, when you hover over it, displays a Find More Apps balloon tip. Clicking on the link opens the (same) Browse more apps page as the Splunk Apps link mentioned earlier:

Choose a home dashboard provides an intuitive way to select an existing (simple XML) dashboard and set it as part of your Splunk Welcome or Home page. This sets you at a familiar starting point each time you enter Splunk. The following screenshot displays the Choose Default Dashboard dialog:

Once you select (from the drop-down list) an existing dashboard, it will be a part of your welcome screen every time you log in to Splunk—until you change it. There are no dashboards installed by default after installing Splunk, except the Search & Reporting app. Once you have created additional dashboards, they can be selected as the default.

The top bar

The bar across the top of the window contains information about where you are as well as quick links to preferences, other apps, and administration.

The current app is specified in the upper-left corner. The following screenshot shows the upper-left Splunk bar when using the Search & Reporting app:

Clicking on the text takes you to the default page for that app. In most apps, the text next to the logo is simply changed, but the whole block can be customized with logos and alternate text by modifying the app's CSS. We will cover this in Chapter 8, Working with Apps:

The upper-right corner of the window, as seen in the previous screenshot, contains action links that are almost always available:

  • The name of the user who is currently logged in appears first. In this case, the user is Administrator. Previously, clicking on the username allowed you to select Edit Account (which would take you to the Your account page) or Logout (of Splunk). In version 7.0, it's a bit different. The first option is now listed as Account Settings, which opens a settings page similar to prior versions (below is the 7.0 page). Logout is the other option, and, like prior versions, it ends the session and forces the user to log in again.

The following screenshot shows what the your account page looks like:

This form presents the global preferences that a user is allowed to change. Other settings that affect users are configured through permissions on objects and settings on roles. (Note that preferences can also be configured using the command-line interface or by modifying specific Splunk configuration files.) Preferences include the following:

  • Full name and Email address are stored for the administrator's convenience.
  • Set password allows you to change your password. This is relevant only if Splunk is configured to use internal authentication. For instance, if the system is configured to use Windows Active Directory via LDAP (a very common configuration), users must change their password in Windows.
  • Global/Time zone can be changed for the logged-in user.
Setting the time zone only affects the time zone used to display the data. It is very important that the date is parsed properly when events are indexed. We will discuss this in detail in >Chapter 2Understanding Search.
  • Default application controls where you first land after login. Most users will want to change this to search.
  • Restart backgrounded jobs controls whether unfinished queries should run again if Splunk is restarted.
  • Search/Search assistant/Syntax highlighting/auto-format and Show line numbers: these properties are used for assistance with command syntax, including examples, autocomplete syntax, or to turn off search assistance. Syntax highlighting displays search string components in different colors.

  • Messages allows you to view any system-level error messages you may have pending. When there is a new message for you to review, a notification displays as a count next to the Messages menu. You can click on the X to remove a message.

  • The Settings link presents the user with the configuration pages for all Splunk Knowledge objects, Distributed environment, System and Licensing, Data, and Users and Authentication settings. For any option that you are unable to see, you do not have the permissions to view or edit it:
  • The Activity menu lists shortcuts to Splunk Jobs, Triggered Alerts, and (in previous versions System Activity) views.
  • You can click on Jobs (to open the search jobs manager window, where you can view and manage currently running searches) or Triggered Alerts (to view scheduled alerts that are triggered).
Note: In version 7.0, System Activity (to see dashboards about user activity and status of the system) has been removed from under Activity. You can actually access all of this detailed information in Search!
  • Help lists links to video tutorials, Splunk Answers, the Splunk Contact Support portal, and online Documentation:
  • Find can be used to search for objects within your Splunk Enterprise instance. These saved objects include Reports, Dashboards, Alerts, and so on. Errors can be searched with the Search & Reporting app by clicking on Open error in search.

The Search & Reporting app

The Search & Reporting app (or just the search app) is where most actions in Splunk start. This app is a dashboard where you will begin your searching.

Data generator

If you want to follow the examples that appear in the next few chapters, install the ImplementingSplunkDataGenerator demo app by following these steps:

  1. Download ImplementingSplunkDataGenerator.tar.gz from the code bundle available at http://www.packtpub.com/support
  2. Choose Manage apps... from the Apps menu
  3. Click on the button labeled Install app from the file
  4. Click on Choose File, select the file, and then click on Upload

This data generator app will produce about 16 megabytes of output per day. The app can be disabled so that it stops producing data by using Manage apps... under the App menu.

The Summary view

Within the Search & Reporting app, the user is presented with the Summary view, which contains information about the data that the user searches by default. This is an important distinction; in a mature Splunk installation, not all users will always search all data by default. But if this is your first trip into Search & Reporting, you'll see the following:

From the screen depicted in the previous screenshot, you can access the Splunk documentation related to What to Search and How to Search. Once you have at least some data indexed (a topic we'll discuss later), Splunk will provide some statistics on the available data under What to Search.

Remember that this reflects only the indexes that this particular user searches by default; there are other events that are indexed by Splunk, including events that Splunk indexes about itself. We will discuss indexes in Chapter 9, Building Advanced Dashboards.

What to Search is shown in the following screenshot:

In previous versions of Splunk, panels such as the All indexed data panel provided statistics for a user's indexed data. Other panels gave a breakdown of data using three important pieces of metadata—Source, Sourcetype, and Hosts. In the current version, 7.0.0, you access this information by clicking on the button labeled Data Summary, which presents the following to the user:

This dialog splits the information into three tabs—Hosts, Sources and Sourcetypes:

  • A host is a captured hostname for an event. The majority of cases, the host field is set to the name of the machine where the data originated. There are cases where this is not known, so the host can also be configured arbitrarily.
  • A source in Splunk is a unique path or name. In a large installation, there may be thousands of machines submitting data, but all data on the same path across these machines counts as one source. When the data source is not a file, the value of the source can be arbitrary. For instance, the name of a script or network port.
  • A source type is an arbitrary categorization of events. There may be many sources across many hosts in the same source type. For instance, given the sources /var/log/access.2012-03-01.log and /var/log/access.2012-03-02.log on the hosts fred and wilma, you could reference all these logs with source type access or any other name that you like.

Let's move on now and discuss each of the Splunk widgets (just below the app name). The first widget is the navigation bar:

As a general rule, within Splunk, items with downward triangles are menus. Items without a downward triangle are links.

We will cover customizing the navigation bar in Chapter 8, Working with Apps.

Next, we find the Search bar. This is where the magic starts. We'll go into great detail shortly:

Search

Okay, we've finally made it to search. This is where the real power of Splunk lies.

For our first search, we will search for the word (not case-specific) error. Click in the search bar, type the word error, and then either press Enter or click on the magnifying glass to the right of the bar:

Upon initiating the search, we are taken to the search results page (which hasn't really changed in version 7.0):

Note that the search we just executed was across All time (by default); to change the search time, you can utilize the Splunk time picker.

However, since the data is randomly generated, not all queries will work as expected and you may have to modify them accordingly.

You can find the steps to upload the datasets in the previous Data generator section.

Refer to the Using the time picker section for details on changing the time frame of your search.

Actions

Let's inspect the elements on this page. Below the Search bar, we have the event count, action icons, and menus:

Starting from the left, we have the following:

  • The number of events matched by the base search. Technically, this may not be the number of results pulled from disk, depending on your search. Also, if your query uses commands, this number may not match what is shown in the event listing.
  • Job: It opens the Search job inspector window, which provides very detailed information about the query that was run.
  • Pause: It causes the current search to stop locating events but keeps the job open. This is useful if you want to inspect the current results to determine whether you want to continue a long-running search.
  • Stop: This stops the execution of the current search but keeps the results generated so far. This is useful when you have found enough and want to inspect or share the results found so far.
  • Share: It shares the search job. This option extends the job's lifetime to seven days and sets the read permissions to everyone.
  • Print: This formats the page for printing and instructs the browser to print.
  • Export: It exports the results. Select this option to output to CSV, raw events, XML, or JavaScript Object Notation (JSON) and specify the number of results to export.
  • Smart mode: This controls the search experience. You can set it to speed up searches by cutting down on the event data it returns and additionally by reducing the number of fields that Splunk will extract by default from the data (Fast mode). You can otherwise set it to return as much event information as possible (Verbose mode). In Smart mode (the default setting), it toggles search behavior based on the type of search you're running.

Timeline

Now we'll skip to the timeline below the action icons:

Along with providing a quick overview of the event distribution over a period of time, the timeline is also a very useful tool for selecting sections of time. Placing the pointer over the timeline displays a popup for the number of events in that slice of time. Clicking on the timeline selects the events for a particular slice of time.

Clicking and dragging selects a range of time:

Once you have selected a period of time, clicking on Zoom to selection changes the time frame and reruns the search for that specific slice of time. Repeating this process is an effective way to drill down to specific events.

Deselect shows all events for the time range selected in the time picker.

Zoom out changes the window of time to a larger period around the events in the current time frame.

The field picker

To the left of the search results, we find the field picker. This is a great tool for discovering patterns and filtering search results:

Fields

The field list contains two lists.

  • Selected Fields, which have their values displayed under the search event in the search results
  • Interesting Fields, which are other fields that Splunk has picked out for you

Above the field list are two links, Hide Fields and All Fields:

  • Hide Fields: Hides the field list area from the view
  • All Fields: Takes you to the Selected Fields window:

Search results

We are almost through with all the widgets on the page. We still have a number of items to cover in the search results section, though, just to be thorough:

As you can see in the previous screenshot, at the top of this section, we have the number of events displayed. When viewing all results in their raw form, this number will match the number above the timeline. This value can be changed either by making a selection on the timeline or by using other search commands.

Next, we have the action icons (described earlier) that affect these particular results.

Under the action icons, we have four results tabs:

  • Events list, which will show the raw events. This is the default view when running a simple search, as we have done so far.
  • Patterns streamlines event pattern detection. A list of the most common patterns among the set of events is returned by your search. A number of events that share a similar structure are represented by these patterns.
  • Statistics populates when you run a search with transforming commands such as stats, top, chart, and so on. The previous keyword search for error does not display any results in this tab because it does not have any transforming commands.
  • Visualization transforms searches and also populates the Visualization tab. The results area of the Visualization tab includes a chart and the statistics table used to generate the chart. Not all searches are eligible for visualization—a concept which will be covered later in this book.

Under the previously described tabs, is the timeline that we will cover in more detail later in this chapter.

Options

Beneath the timeline (starting from the left) is a row of option links, including:

  • Show Fields: Shows the Selected Fields screen
  • List: Allows you to select an output option (Raw, List, or Table) for displaying the search result
  • Format: Provides the ability to set Result display options, such as Show row numbers, Wrap results, the Max lines (to display) and Drilldown as on or off
  • NN Per Page: This is where you can indicate the number of results to show per page (10, 20, or 50)

To the right are options that you can use to choose a page of results, and to change the number of events per page.

In older versions of Splunk (prior to 4.3), these options were available from the Results display options popup dialog.

Events viewer

Finally, we make it to the actual events. Let's examine a single event:

Starting from the left, we have:

  • Event Details: Clicking here (indicated by the right facing arrow) opens the selected event, provides specific information about the event by type, field, and value, and allows you the ability to perform specific actions on a particular event field. In addition, Splunk offers a button labeled Event Actions to access workflow actions, a few of which are always available.
  • Build Event Type: Event types are a way to name events that match a certain query. We will dive into event types in Chapter 7, Extending Search.
  • Extract Fields: This launches an interface for creating custom field extractions. We will cover field extraction in Chapter 3, Tables, Charts, and Fields.
  • Show Source: This pops up a window with a simulated view of the original source.
  • The event number: Raw search results are always returned in the order most recent first.
  • Next appear any workflow actions that have been configured. Workflow actions let you create new searches or links to other sites, using data from an event. We will discuss workflow actions in Chapter 7, Extending Search.
  • Next comes the parsed date from this event, displayed in the time zone selected by the user. This is an important and often confusing distinction. In most installations, everything is in one time zone—the servers, the user, and the events. When one of these three things is not in the same time zone as the others, things can get confusing. We will discuss time in great detail in Chapter 2, Understanding Search.
  • Next, we see the raw event itself. This is what Splunk saw as an event. With no help, Splunk can do a good job finding the date and breaking lines appropriately; but as we will see later, with a little help, event parsing can be more reliable and more efficient.
  • Below the event are the fields that were selected in the field picker. Clicking on the value adds the field value to the search.

Using the time picker

Now that we've looked through all the widgets, let's use them to modify our search. First, we will change our time. The default setting of All time is fine when there are few events, but when Splunk has been gathering events over a period of time (perhaps for weeks or months), this is less than optimal. Let's change our search time to one hour:

The search will run again, and now we see results for the last hour only. Let's try a custom time. Date Range is an option:

If you know specifically when an event happened, you can drill down to whatever time range you want here. We will examine the other options in Chapter 2, Understanding Search.

The time zone used in Custom Time Range is the time zone selected in the user's preferences, which is, by default, the time zone of the Splunk server.
Left arrow icon Right arrow icon
Download code icon Download Code

Key benefits

  • Enrich machine-generated data and transform it into useful, meaningful insights
  • Perform search operations and configurations, build dashboards, and manage logs
  • Extend Splunk services with scripts and advanced configurations to process optimal results

Description

Splunk is the leading platform that fosters an efficient methodology and delivers ways to search, monitor, and analyze growing amounts of big data. This book will allow you to implement new services and utilize them to quickly and efficiently process machine-generated big data. We introduce you to all the new features, improvements, and offerings of Splunk 7. We cover the new modules of Splunk: Splunk Cloud and the Machine Learning Toolkit to ease data usage. Furthermore, you will learn to use search terms effectively with Boolean and grouping operators. You will learn not only how to modify your search to make your searches fast but also how to use wildcards efficiently. Later you will learn how to use stats to aggregate values, a chart to turn data, and a time chart to show values over time; you'll also work with fields and chart enhancements and learn how to create a data model with faster data model acceleration. Once this is done, you will learn about XML Dashboards, working with apps, building advanced dashboards, configuring and extending Splunk, advanced deployments, and more. Finally, we teach you how to use the Machine Learning Toolkit and best practices and tips to help you implement Splunk services effectively and efficiently. By the end of this book, you will have learned about the Splunk software as a whole and implemented Splunk services in your tasks at projects

Who is this book for?

This book is intended for data analysts, business analysts, and IT administrators who want to make the best use of big data, operational intelligence, log management, and monitoring within their organization. Some knowledge of Splunk services will help you get the most out of the book

What you will learn

  • Focus on the new features of the latest version of Splunk Enterprise 7
  • Master the new offerings in Splunk: Splunk Cloud and the Machine Learning Toolkit
  • Create efficient and effective searches within the organization
  • Master the use of Splunk tables, charts, and graph enhancements
  • Use Splunk data models and pivots with faster data model acceleration
  • Master all aspects of Splunk XML dashboards with hands-on
  • applications
  • Create and deploy advanced Splunk dashboards to share valuable business insights with peers

Product Details

Country selected
Publication date, Length, Edition, Language, ISBN-13
Publication date : Mar 29, 2018
Length: 576 pages
Edition : 3rd
Language : English
ISBN-13 : 9781788836289
Vendor :
Splunk
Category :
Languages :
Tools :

What do you get with a Packt Subscription?

Free for first 7 days. $19.99 p/m after that. Cancel any time!
Product feature icon Unlimited ad-free access to the largest independent learning library in tech. Access this title and thousands more!
Product feature icon 50+ new titles added per month, including many first-to-market concepts and exclusive early access to books as they are being written.
Product feature icon Innovative learning tools, including AI book assistants, code context explainers, and text-to-speech.
Product feature icon Thousands of reference materials covering every tech concept you need to stay up to date.
Subscribe now
View plans & pricing

Product Details

Publication date : Mar 29, 2018
Length: 576 pages
Edition : 3rd
Language : English
ISBN-13 : 9781788836289
Vendor :
Splunk
Category :
Languages :
Tools :

Packt Subscriptions

See our plans and pricing
Modal Close icon
$19.99 billed monthly
Feature tick icon Unlimited access to Packt's library of 7,000+ practical books and videos
Feature tick icon Constantly refreshed with 50+ new titles a month
Feature tick icon Exclusive Early access to books as they're written
Feature tick icon Solve problems while you work with advanced search and reference features
Feature tick icon Offline reading on the mobile app
Feature tick icon Simple pricing, no contract
$199.99 billed annually
Feature tick icon Unlimited access to Packt's library of 7,000+ practical books and videos
Feature tick icon Constantly refreshed with 50+ new titles a month
Feature tick icon Exclusive Early access to books as they're written
Feature tick icon Solve problems while you work with advanced search and reference features
Feature tick icon Offline reading on the mobile app
Feature tick icon Choose a DRM-free eBook or Video every month to keep
Feature tick icon PLUS own as many other DRM-free eBooks or Videos as you like for just $5 each
Feature tick icon Exclusive print discounts
$279.99 billed in 18 months
Feature tick icon Unlimited access to Packt's library of 7,000+ practical books and videos
Feature tick icon Constantly refreshed with 50+ new titles a month
Feature tick icon Exclusive Early access to books as they're written
Feature tick icon Solve problems while you work with advanced search and reference features
Feature tick icon Offline reading on the mobile app
Feature tick icon Choose a DRM-free eBook or Video every month to keep
Feature tick icon PLUS own as many other DRM-free eBooks or Videos as you like for just $5 each
Feature tick icon Exclusive print discounts

Frequently bought together


Stars icon
Total $ 159.97
Splunk 7 Essentials, Third Edition
$43.99
Splunk Operational Intelligence Cookbook
$60.99
Implementing Splunk 7, Third Edition
$54.99
Total $ 159.97 Stars icon

Table of Contents

14 Chapters
The Splunk Interface Chevron down icon Chevron up icon
Understanding Search Chevron down icon Chevron up icon
Tables, Charts, and Fields Chevron down icon Chevron up icon
Data Models and Pivots Chevron down icon Chevron up icon
Simple XML Dashboards Chevron down icon Chevron up icon
Advanced Search Examples Chevron down icon Chevron up icon
Extending Search Chevron down icon Chevron up icon
Working with Apps Chevron down icon Chevron up icon
Building Advanced Dashboards Chevron down icon Chevron up icon
Summary Indexes and CSV Files Chevron down icon Chevron up icon
Configuring Splunk Chevron down icon Chevron up icon
Advanced Deployments Chevron down icon Chevron up icon
Extending Splunk Chevron down icon Chevron up icon
Machine Learning Toolkit Chevron down icon Chevron up icon

Customer reviews

Rating distribution
Full star icon Full star icon Full star icon Full star icon Full star icon 5
(4 Ratings)
5 star 100%
4 star 0%
3 star 0%
2 star 0%
1 star 0%
Pooja Autade Jun 26, 2019
Full star icon Full star icon Full star icon Full star icon Full star icon 5
Very helpful
Amazon Verified review Amazon
Brandy Jul 25, 2018
Full star icon Full star icon Full star icon Full star icon Full star icon 5
This book will give you all of what you need as an engineer
Amazon Verified review Amazon
M. Eagles Jul 22, 2020
Full star icon Full star icon Full star icon Full star icon Full star icon 5
Book does a good job of covering most Splunk topics.I recommend this book to anyone just getting started with Splunk.
Amazon Verified review Amazon
Gregory CHRISTINE Jun 25, 2019
Full star icon Full star icon Full star icon Full star icon Full star icon 5
hate de faire le tour
Amazon Verified review Amazon
Get free access to Packt library with over 7500+ books and video courses for 7 days!
Start Free Trial

FAQs

What is included in a Packt subscription? Chevron down icon Chevron up icon

A subscription provides you with full access to view all Packt and licnesed content online, this includes exclusive access to Early Access titles. Depending on the tier chosen you can also earn credits and discounts to use for owning content

How can I cancel my subscription? Chevron down icon Chevron up icon

To cancel your subscription with us simply go to the account page - found in the top right of the page or at https://subscription.packtpub.com/my-account/subscription - From here you will see the ‘cancel subscription’ button in the grey box with your subscription information in.

What are credits? Chevron down icon Chevron up icon

Credits can be earned from reading 40 section of any title within the payment cycle - a month starting from the day of subscription payment. You also earn a Credit every month if you subscribe to our annual or 18 month plans. Credits can be used to buy books DRM free, the same way that you would pay for a book. Your credits can be found in the subscription homepage - subscription.packtpub.com - clicking on ‘the my’ library dropdown and selecting ‘credits’.

What happens if an Early Access Course is cancelled? Chevron down icon Chevron up icon

Projects are rarely cancelled, but sometimes it's unavoidable. If an Early Access course is cancelled or excessively delayed, you can exchange your purchase for another course. For further details, please contact us here.

Where can I send feedback about an Early Access title? Chevron down icon Chevron up icon

If you have any feedback about the product you're reading, or Early Access in general, then please fill out a contact form here and we'll make sure the feedback gets to the right team. 

Can I download the code files for Early Access titles? Chevron down icon Chevron up icon

We try to ensure that all books in Early Access have code available to use, download, and fork on GitHub. This helps us be more agile in the development of the book, and helps keep the often changing code base of new versions and new technologies as up to date as possible. Unfortunately, however, there will be rare cases when it is not possible for us to have downloadable code samples available until publication.

When we publish the book, the code files will also be available to download from the Packt website.

How accurate is the publication date? Chevron down icon Chevron up icon

The publication date is as accurate as we can be at any point in the project. Unfortunately, delays can happen. Often those delays are out of our control, such as changes to the technology code base or delays in the tech release. We do our best to give you an accurate estimate of the publication date at any given time, and as more chapters are delivered, the more accurate the delivery date will become.

How will I know when new chapters are ready? Chevron down icon Chevron up icon

We'll let you know every time there has been an update to a course that you've bought in Early Access. You'll get an email to let you know there has been a new chapter, or a change to a previous chapter. The new chapters are automatically added to your account, so you can also check back there any time you're ready and download or read them online.

I am a Packt subscriber, do I get Early Access? Chevron down icon Chevron up icon

Yes, all Early Access content is fully available through your subscription. You will need to have a paid for or active trial subscription in order to access all titles.

How is Early Access delivered? Chevron down icon Chevron up icon

Early Access is currently only available as a PDF or through our online reader. As we make changes or add new chapters, the files in your Packt account will be updated so you can download them again or view them online immediately.

How do I buy Early Access content? Chevron down icon Chevron up icon

Early Access is a way of us getting our content to you quicker, but the method of buying the Early Access course is still the same. Just find the course you want to buy, go through the check-out steps, and you’ll get a confirmation email from us with information and a link to the relevant Early Access courses.

What is Early Access? Chevron down icon Chevron up icon

Keeping up to date with the latest technology is difficult; new versions, new frameworks, new techniques. This feature gives you a head-start to our content, as it's being created. With Early Access you'll receive each chapter as it's written, and get regular updates throughout the product's development, as well as the final course as soon as it's ready.We created Early Access as a means of giving you the information you need, as soon as it's available. As we go through the process of developing a course, 99% of it can be ready but we can't publish until that last 1% falls in to place. Early Access helps to unlock the potential of our content early, to help you start your learning when you need it most. You not only get access to every chapter as it's delivered, edited, and updated, but you'll also get the finalized, DRM-free product to download in any format you want when it's published. As a member of Packt, you'll also be eligible for our exclusive offers, including a free course every day, and discounts on new and popular titles.