Creating a dashboard from a Look
After you have learned how to explore and visualize data, you can start creating dashboards. Dashboards let you put multiple tables or graphs on one page so you can quickly see related information. You can also make dashboards interactive so users can filter them down to the specific data they want.
How to do it...
The steps for this recipe are as follows:
- On the Looker home page, click on Folders.
- In My folder (where you have a list of Looks you created), open the Nb of Sessions per Day Look by clicking on it.
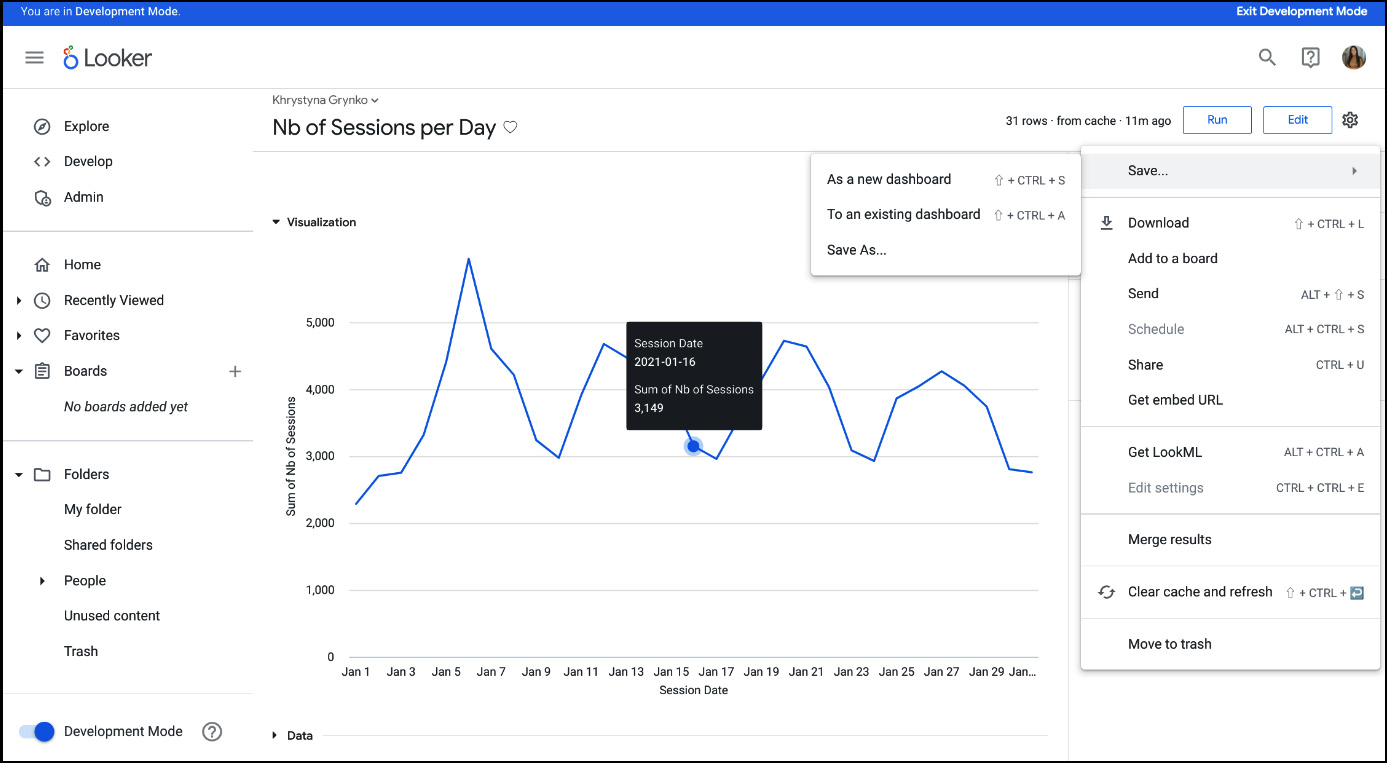
- In the Nb of Sessions per Day Look, click on the gear icon in the top-right corner and click Save… and then As a new dashboard (Figure 1.45). Give your new dashboard a name,
Sessions Dashboard, and click Save.

Figure 1.45 – Saving as a new dashboard
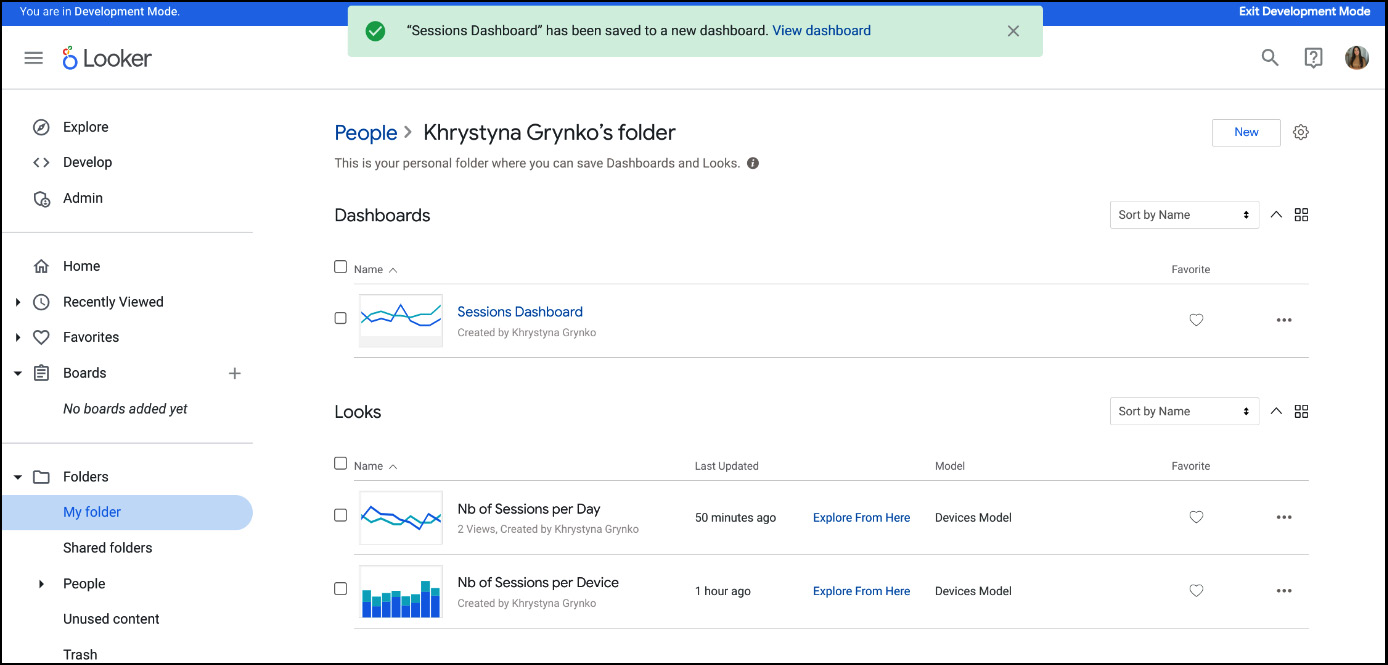
- Go back to Folders followed by My folder to check whether the dashboard was created (Figure 1.46).

Figure 1.46 – My folder: Dashboard and Looks
- Click on the Nb of Sessions per Device Look, then once in the Look, click on the gear icon in the top-right corner, click Save and To an existing dashboard, and then choose the dashboard you created in the previous steps, Sessions Dashboard. Click Save to Dashboard.
- In the green ribbon that appears after you click on Save to Dashboard, click on Sessions Dashboard (Figure 1.47) to check your dashboard and whether all the Looks were added.

Figure 1.47 – Dashboard creation message
A dashboard can contain more than two Looks. In this recipe, we explored a simple dashboard to understand how it works, but we’ll dive deeper into this topic later in this book.
How it works...
In this recipe, we created the dashboard from a Look. Note that Look should be in the same folder with the dashboard. There are multiple other ways to create dashboards in Looker, as follows:
- Create an empty dashboard and then build Looks through the Explore interface in the dashboard (click Add in the top-left corner of the dashboard)
- Create a dashboard from the LookML dashboard file
- Create a dashboard through the Looker API
See also
- Chapter 4, Customizing and Serving the Dashboards
- Chapter 5, Making Dashboards Interactive through Dynamic Elements
- Looker dashboards: https://cloud.google.com/looker/docs/dashboards


