Identifying data to remove from the dataset
With the amount of data that is freely available today, databases are getting larger and larger, and that makes it a challenge for data analysts to analyze the data properly. A challenge that data analysts face is determining what data is required to be able to produce a dataset that provides the information that is relevant for analysis. In this chapter, you will learn how to reduce the amount of data and columns that are contained in a dataset without affecting the result set.
To do this, you will need to first understand what data is required through interviews with the people requesting the result set. The interview process will help you to understand what the person requesting the result set wants to accomplish and give you an idea of where to find the data and what database and table contain the information that is required. With this knowledge, you will need to perform some initial analysis of the data in the database tables to determine how much and what columns of data are needed. This is often done through simple queries that perform row counts and table descriptions. The following are examples of the type of queries that may be used.
The following is a query to get an idea of the data in a table:
SELECT TOP (1000) *
  FROM database.schema.table;
This type of query will give you an idea of what data is available in a particular table by showing you up to the first 1,000 rows in the table, and if the table has fewer than 1,000 rows, it will show you all of the rows in the table.
The following query will show you all of the columns and their data types in a particular schema:
SELECT Table_name as [Table] ,
       Column_name as [Column] ,
       Table_catalog as [Database],
       table_schema as [Schema]
FROM   information_schema.columns
WHERE  table_schema = 'Fact'
ORDER BY Table_name, Column_name;
This type of query will read the system tables in the database to return the names of all of the Column instances that each table in the schema contains. The table that we are interested in is the information_schema.columns table. With this information, you can determine what columns are available for you to use.
With this information, let’s look at an example for solving the following sample request that was determined by interviewing a user. For the examples in this chapter, we will assume that the interview has resulted in the following analysis:
We want to be able to analyze the number of orders that resort in a back-order item being created by each year and month and how many customers were impacted.
How do we go about this? Let us check in the following sections.
Reducing the amount of data
We start by determining which tables seem to contain the data that is required as just described:
SELECT Table_name as [Table] ,
       Column_name as [Column] ,
       Table_catalog as [Database],
       Table_schema as [Schema]
FROM information_schema.columns
Where Table_schema = 'fact'
AND Table_name = 'Order'
ORDER BY Table_name, Column_name;
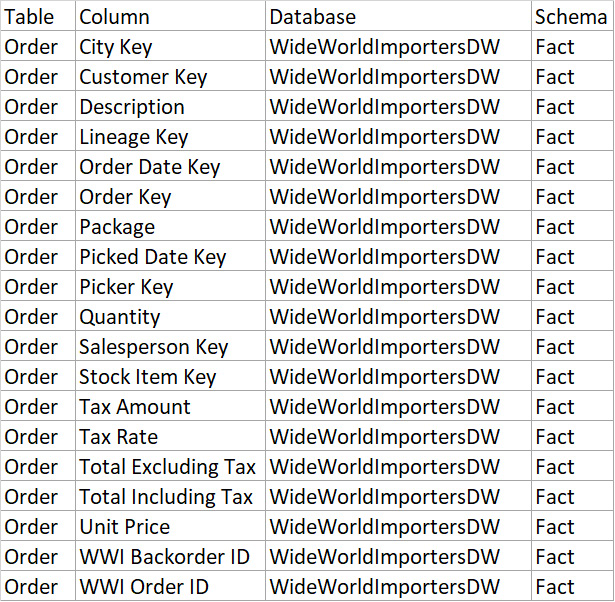
Figure 1.1 shows the results of the query:

Figure 1.1 – Results of the query to show all columns in a table
Based on the results, the Fact.Order table is a good candidate to start with, so let’s run the following query:
SELECT TOP (1000) *
  FROM [WideWorldImportersDW].[Fact].[Order];
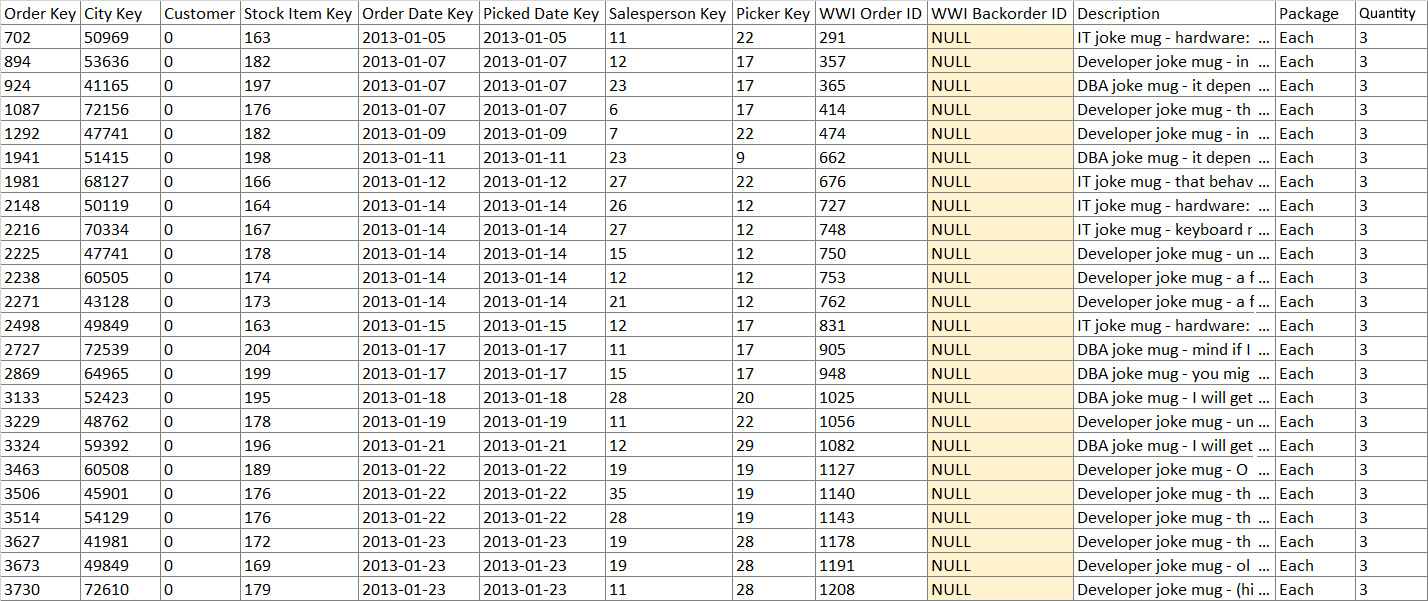
Figure 1.2 shows the results of this query:

Figure 1.2 – Sample data and columns from the Fact.Order query
This query shows us that there are 19 columns, and of those columns, we are only interested in Customer Key, Stock Item Key, Order Date Key, and WWI Backorder ID. So this is, in fact, the table that we should be using. Now that we have identified the table that we want to use, let’s run the following query to see how much data is in the table:
SELECT count(*)
FROM [WideWorldImportersDW].[Fact].[Order]
The results show that there are 231,412 rows of data in the table, so how do we reduce the amount of data that will be required in the result set? The answer is that we do some more analysis; for example, instead of keeping all the columns in the table, we will only include the columns in the query that are needed, as identified earlier. We also know that we are only interested in orders with a back-ordered item. So, let’s run this query and see how many records remain:
SELECT count(*)
FROM [WideWorldImportersDW].[Fact].[Order]
WHERE [WWI Backorder ID] IS NOT NULL;
The result from this query shows that we have reduced the size to 20,593 records; this is a much more manageable size to work with. The query that will get us the initial result set is as follows:
SELECT [Order Date Key] as "Order Date",
    [Order Key] as "Order",
 [stock item key] as "Stock Item",
 [Customer Key] as "Customer",
 [WWI Order ID] as "WWI Order",
 [WWI Backorder ID] as "WWI Backorder"
FROM [WideWorldImportersDW].[Fact].[Order]
WHERE [WWI Backorder ID] IS NOT NULL;
To explain what you have just done with this query, let’s break down each step.
The names after SELECT are the columns that you want the query to return in the result set. In this case, you are returning Order Date Key, Order Key, Stock item key, Customer Key, WWI Order ID, and WWI Backorder ID.
With these columns, you will have a date field in which to analyze the data by month, Order Key allows you to see how many distinct orders are impacted, stock item key tells you which items in the order have been back-ordered, Customer Key tells you which customer has been impacted by the backorders, and WWI Order ID lets you determine how many orders have been impacted. WWI Backorder ID is included when you want to see how many backorders are in the system.
FROM tells the query where to get the data from, in this case, from the WWI database using the Fact Order table.
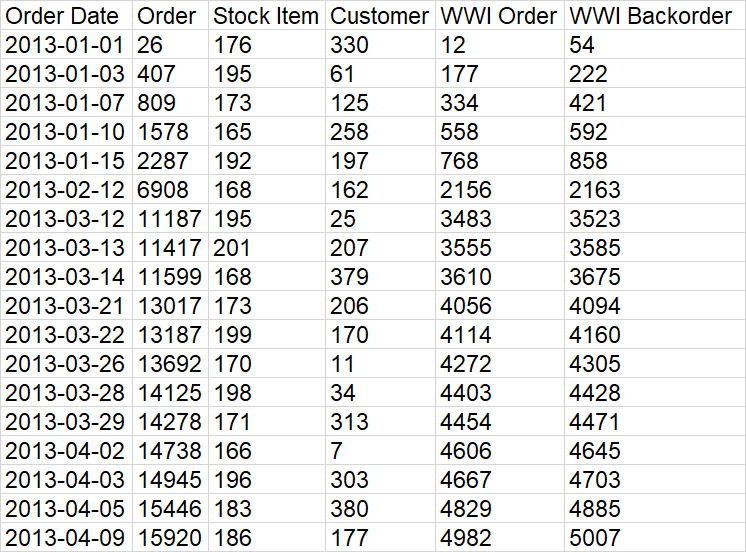
The most important part is the WHERE clause; this is the part of the code that reduces the size of the result set to a manageable size. After all, you are not interested in all the orders in the table, only the orders that have an item that is on backorder. Figure 1.3 shows what the result set will look like:

Figure 1.3 – Sample result set
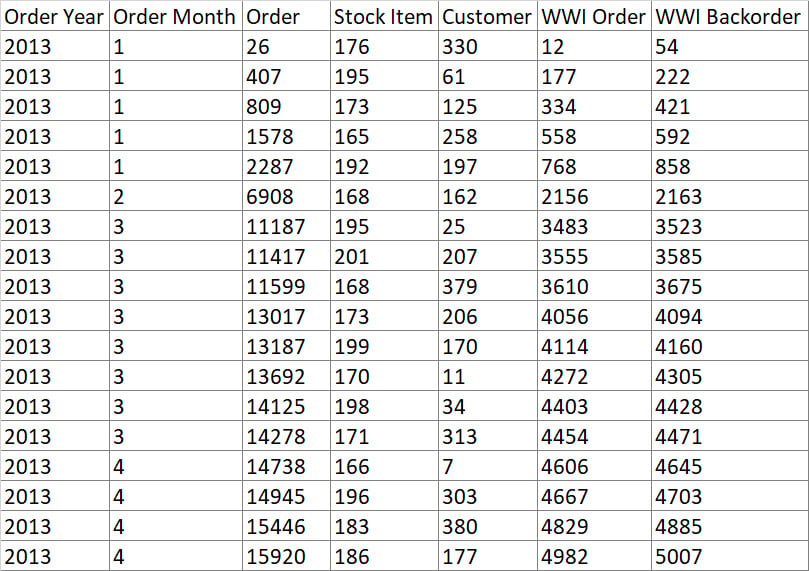
Since you are interested in data by months, you will want to modify the Order Date Key column for the year and a column for the month as follows:
SELECT Year([Order Date Key]) as "Order Year",
       Month([Order Date Key]) as "Order Month",
  [Order Key] as "Order",
  [stock item key] as "Stock Item",
  [Customer Key] as "Customer",
  [WWI Order ID] as "WWI Order",
  [WWI Backorder ID] as "WWI Backorder"
FROM [WideWorldImportersDW].[Fact].[Order]
WHERE [WWI Backorder ID] IS NOT NULL;
You now have this result set you can see in Figure 1.4, and you are ready to answer the question that came from the interview with the user:

Figure 1.4 – Result set totaling by month
Now that you have learned how to get the data that you require for analysis, we will discuss the impact this filtering of data has on the aggregations that you may want to do in the analysis.


