Search icon CANCEL
Subscription
0
Cart icon
Your Cart (0 item)
Close icon
You have no products in your basket yet
Save more on your purchases! discount-offer-chevron-icon
Savings automatically calculated. No voucher code required.
Arrow left icon
Explore Products
Best Sellers
New Releases
Books
Videos
Audiobooks
Learning Hub
Newsletter Hub
Free Learning
Arrow right icon
timer SALE ENDS IN
0 Days
:
00 Hours
:
00 Minutes
:
00 Seconds
Arrow up icon
GO TO TOP
Hands-On Network Forensics

You're reading from   Hands-On Network Forensics Investigate network attacks and find evidence using common network forensic tools

Arrow left icon
Product type Paperback
Published in Mar 2019
Publisher
ISBN-13 9781789344523
Length 358 pages
Edition 1st Edition
Languages
Concepts
Arrow right icon
Author (1):
Arrow left icon
Nipun Jaswal Nipun Jaswal
Author Profile Icon Nipun Jaswal
Nipun Jaswal
Arrow right icon
View More author details
Toc

Table of Contents (16) Chapters Close

Preface 1. Section 1: Obtaining the Evidence FREE CHAPTER
2. Introducing Network Forensics 3. Technical Concepts and Acquiring Evidence 4. Section 2: The Key Concepts
5. Deep Packet Inspection 6. Statistical Flow Analysis 7. Combatting Tunneling and Encryption 8. Section 3: Conducting Network Forensics
9. Investigating Good, Known, and Ugly Malware 10. Investigating C2 Servers 11. Investigating and Analyzing Logs 12. WLAN Forensics 13. Automated Evidence Aggregation and Analysis 14. Other Books You May Enjoy 15. Assessments

Case study – ICMP Flood or something else

Imagine you are a network forensics expert who has been tasked with analyzing the PCAP file. As soon as you open the file in Wireshark, you are presented with the following:
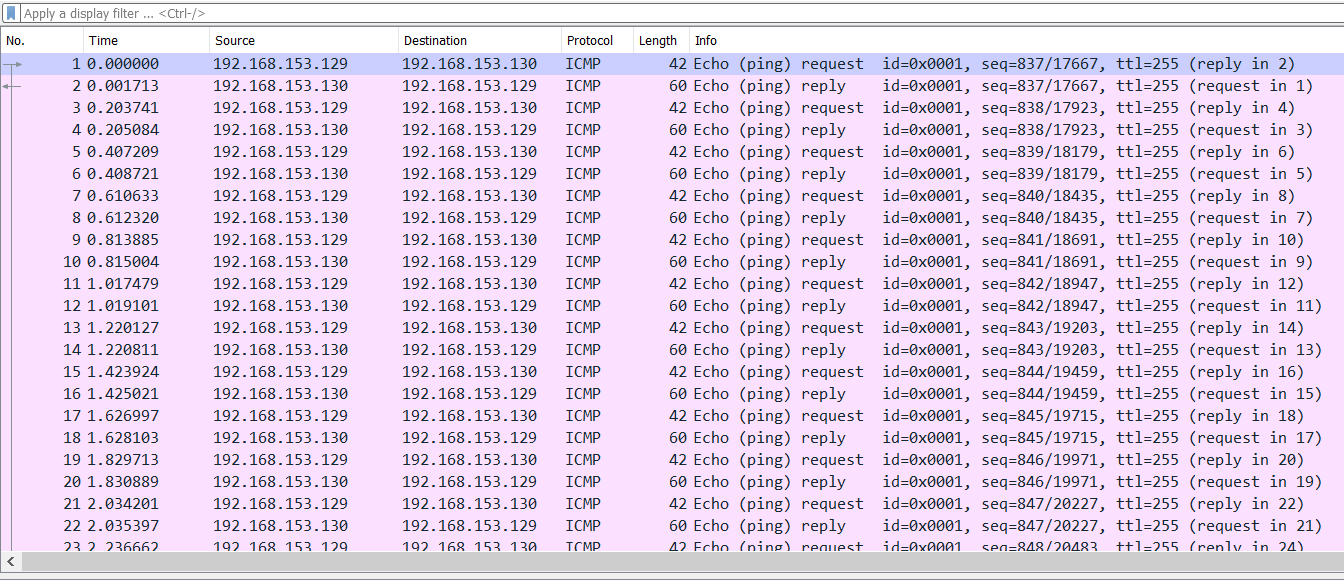
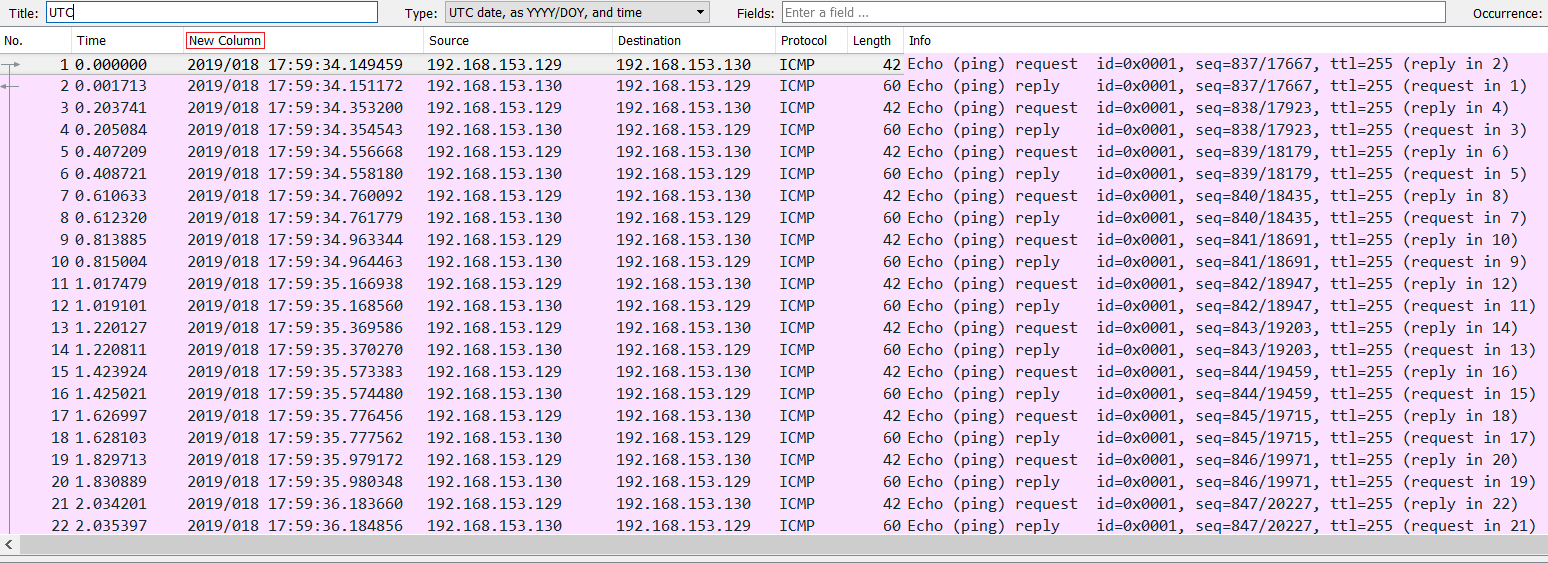
What we can see from the capture file is that it contains a ton of ICMP packets traveling to and from 192.168.153.129 and 192.168.153.130. We quickly added a new column by right-clicking the column header in Wireshark and choosing Column Preferences and adding a new column by clicking the + button and choosing its type as UTC for the UTC time, as shown in the following screenshot:
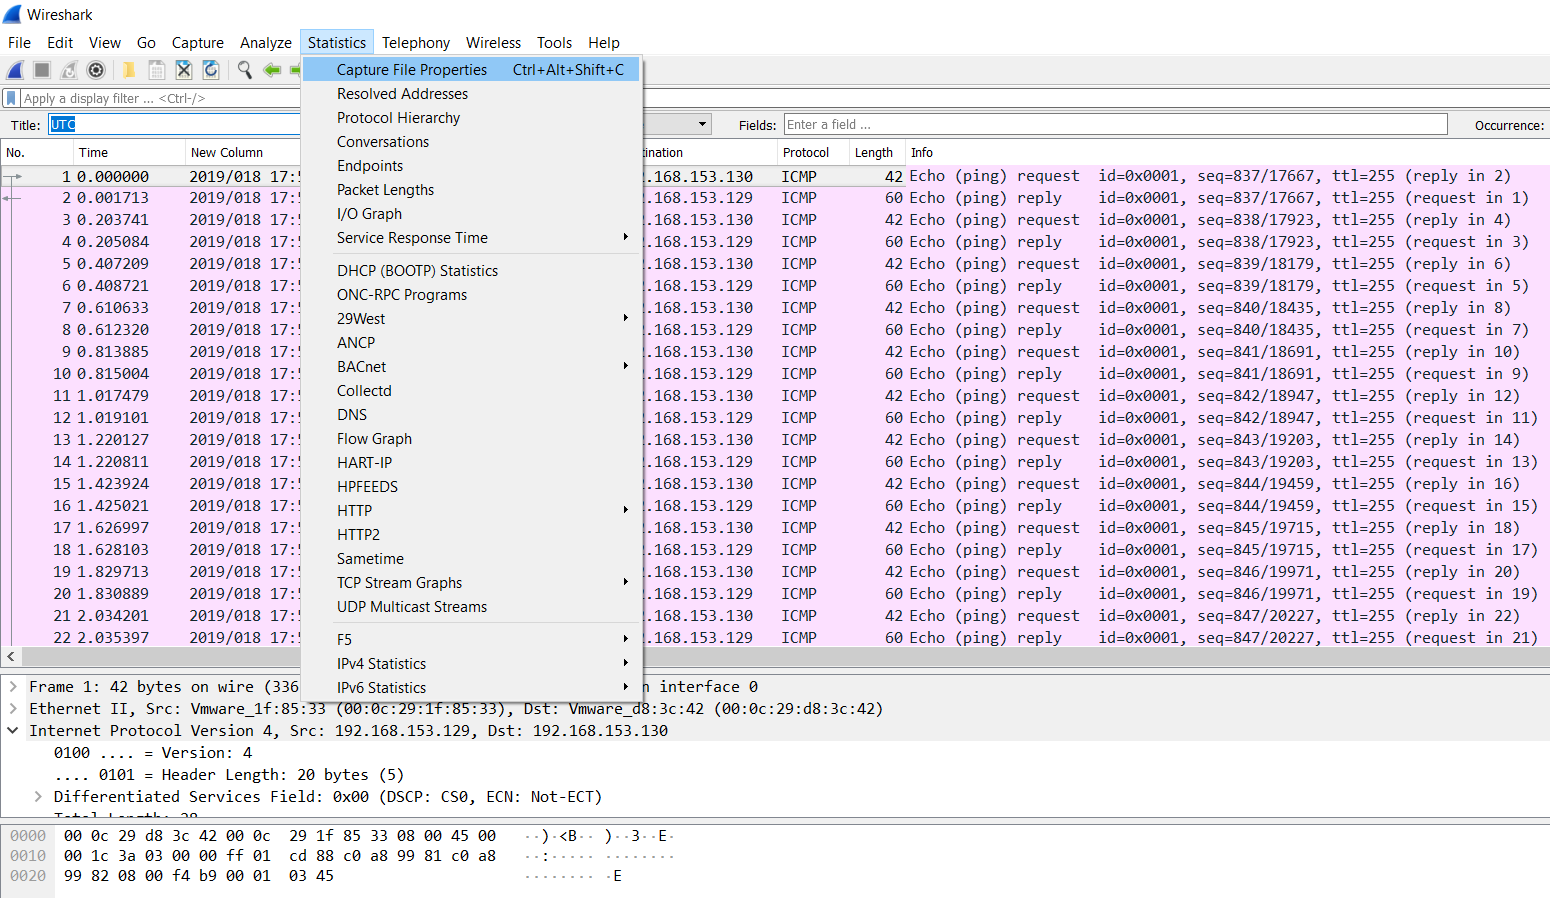
Next, we go to the Statistics tab and choose Capture File Properties:
The preceding option will populate the following window:
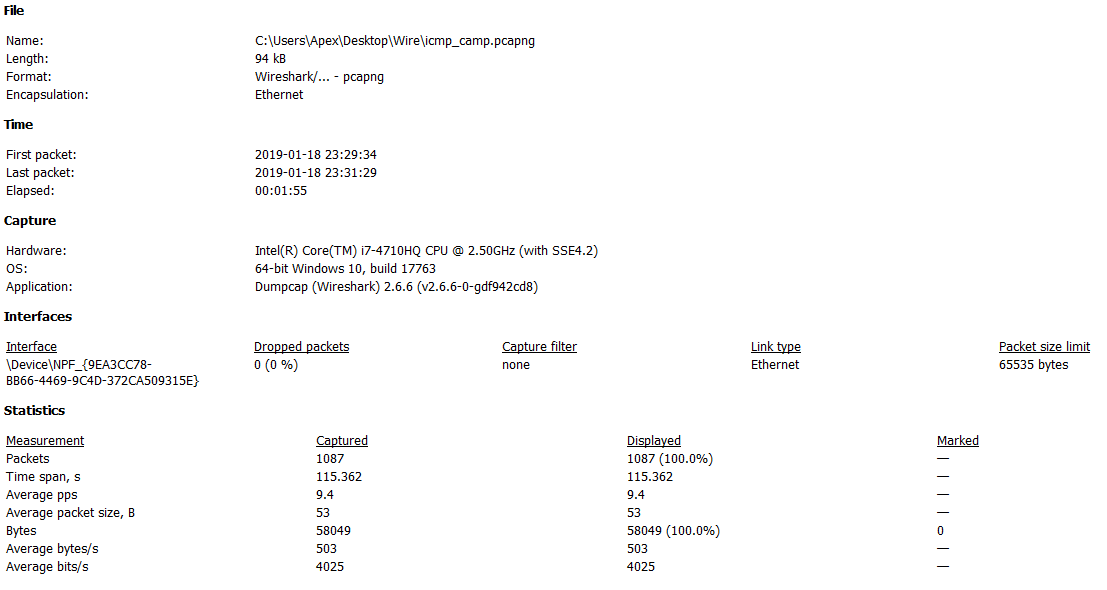
We can see a good amount of detail related to the capture file, such as the date and time of the first packet, last packet, duration, average...

lock icon The rest of the chapter is locked
Register for a free Packt account to unlock a world of extra content!
A free Packt account unlocks extra newsletters, articles, discounted offers, and much more. Start advancing your knowledge today.
Unlock this book and the full library FREE for 7 days
Get unlimited access to 7000+ expert-authored eBooks and videos courses covering every tech area you can think of
Renews at $19.99/month. Cancel anytime
Banner background image