


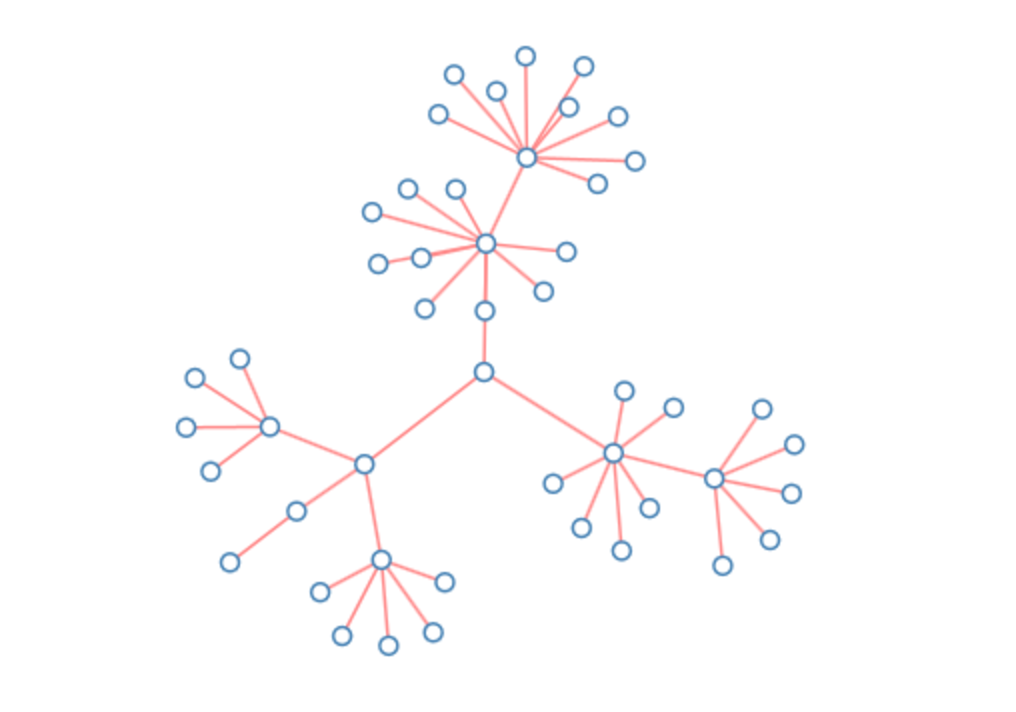
A force layout renders a graph as a set of nodes and interconnected links. It's easiest to visualize by looking at an example. The following graph is a very simple example of what you can create with a force layout:
While this is a very simple example, if you have the time, you can create beautiful layouts. An especially beautiful one is the one created by (amongst others) the creator of D3:
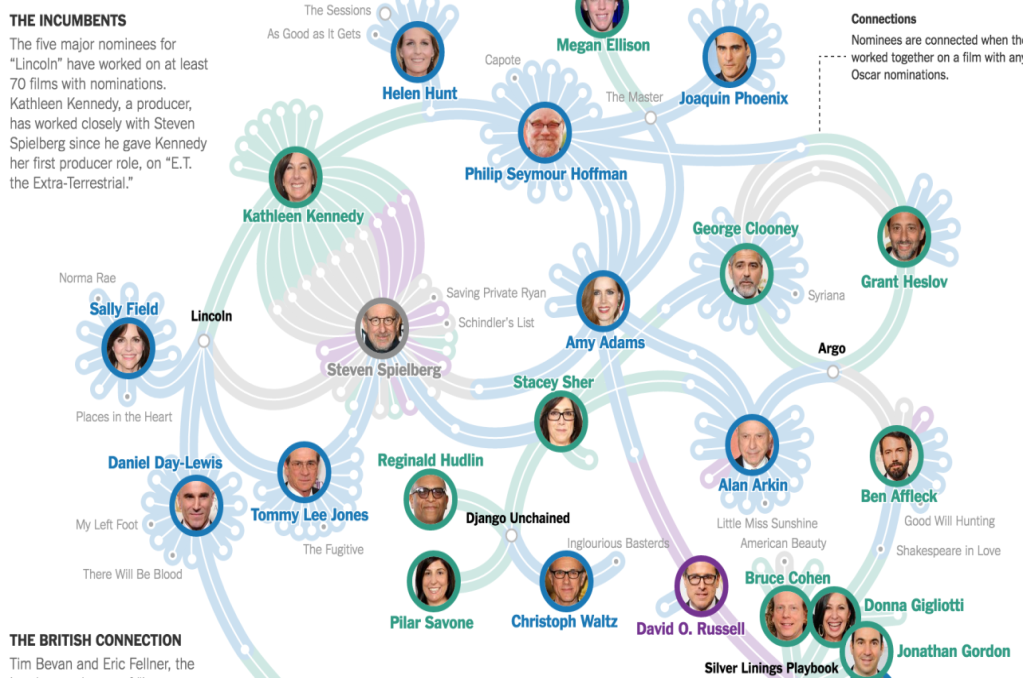
You can interact with this visualization here: http://www.nytimes.com/interactive/2013/02/20/movies/among-the-oscar-contenders-a-host-of-connections.html.
For our first visualization in this chapter, we're going to create a force layout that uses information from the Simpsons. We're going to show which characters appear in a specific location in an episode. The final result looks something like this:

Here we have a force layout (which you can see in DVD3/src/chapter-04/D04-01.html) with the following...


