The graphs and maps we are familiar with cannot be combined into a single page on their own—for that, we may use an entity called a screen.
Let's create one together:
- Navigate to Monitoring | Screens, and click on the Create screen button.
- Enter Local servers in the Name field and 2 in the Columns field. We will be able to add more later, if needed:
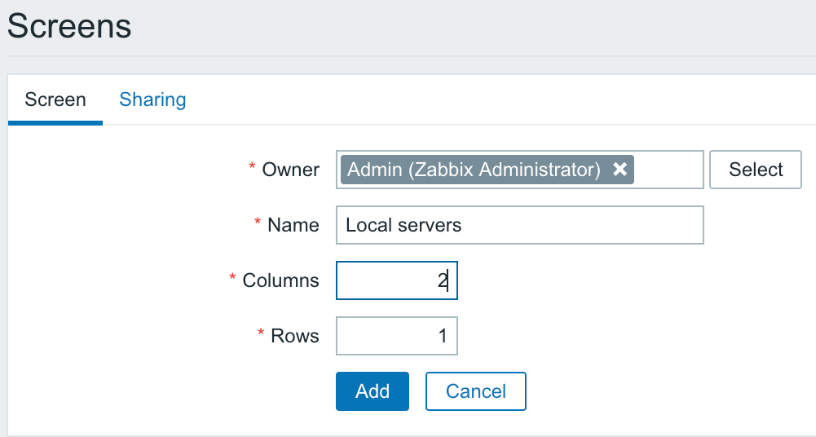
As with network maps, screens may also be created and shared by users.
- Click on Add, and then click on Constructor next to Local servers. We are presented with a fairly unimpressive view:
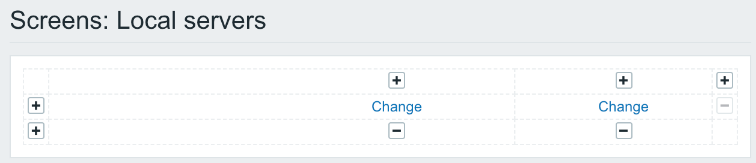
So, it's up to us to spice it up.
- Click on the left-hand Change link, and we have an editing form replacing the previous cell's contents. The default resource type is graph, and we created some graphs earlier.
- Click on Select next to the Graph field. In the upcoming window, make sure A test host is selected in...