Search icon CANCEL
Subscription
0
Cart icon
Your Cart (0 item)
Close icon
You have no products in your basket yet
Arrow left icon
Explore Products
Best Sellers
New Releases
Books
Videos
Audiobooks
Learning Hub
Free Learning
Arrow right icon
Arrow up icon
GO TO TOP
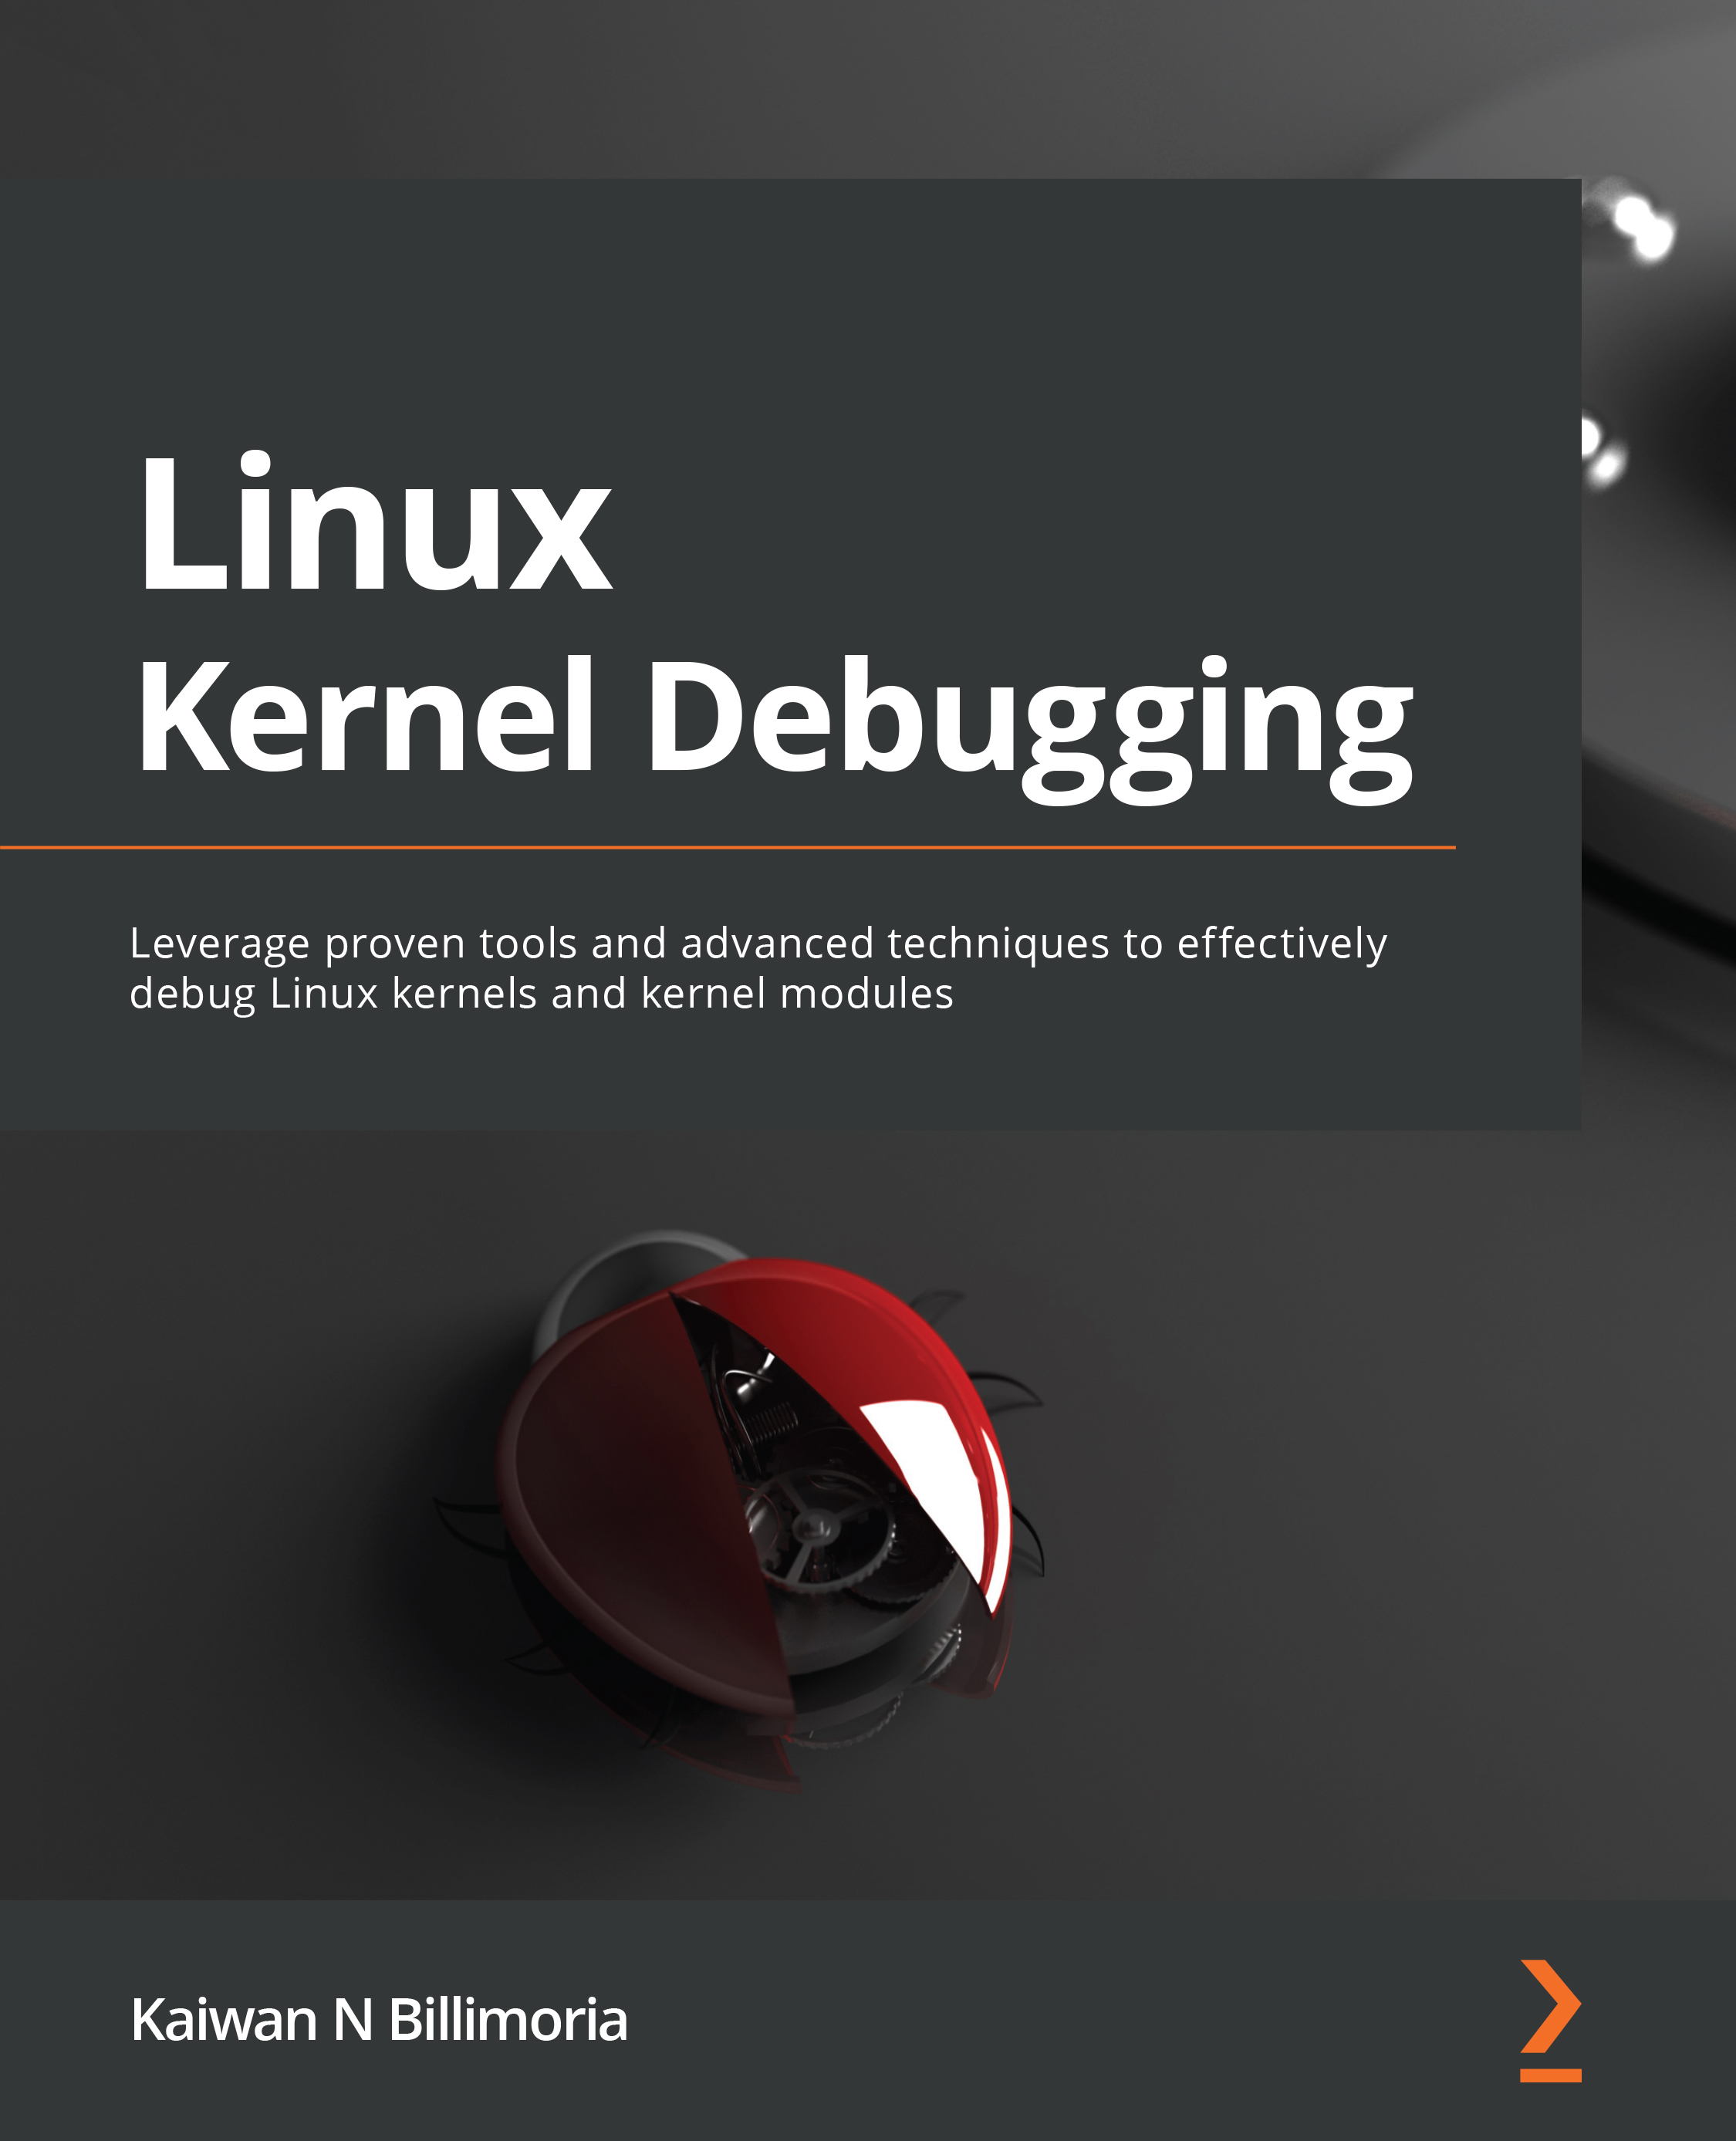
Linux Kernel Debugging

You're reading from   Linux Kernel Debugging Leverage proven tools and advanced techniques to effectively debug Linux kernels and kernel modules

Arrow left icon
Product type Paperback
Published in Aug 2022
Publisher Packt
ISBN-13 9781801075039
Length 638 pages
Edition 1st Edition
Tools
Arrow right icon
Author (1):
Arrow left icon
Kaiwan N. Billimoria Kaiwan N. Billimoria
Author Profile Icon Kaiwan N. Billimoria
Kaiwan N. Billimoria
Arrow right icon
View More author details
Toc

Table of Contents (17) Chapters Close

Preface 1. Part 1: A General Introduction and Approaches to Kernel Debugging
2. Chapter 1: A General Introduction to Debugging Software FREE CHAPTER 3. Chapter 2: Approaches to Kernel Debugging 4. Part 2: Kernel and Driver Debugging Tools and Techniques
5. Chapter 3: Debug via Instrumentation – printk and Friends 6. Chapter 4: Debug via Instrumentation – Kprobes 7. Chapter 5: Debugging Kernel Memory Issues – Part 1 8. Chapter 6: Debugging Kernel Memory Issues – Part 2 9. Chapter 7: Oops! Interpreting the Kernel Bug Diagnostic 10. Chapter 8: Lock Debugging 11. Part 3: Additional Kernel Debugging Tools and Techniques
12. Chapter 9: Tracing the Kernel Flow 13. Chapter 10: Kernel Panic, Lockups, and Hangs 14. Chapter 11: Using Kernel GDB (KGDB) 15. Chapter 12: A Few More Kernel Debugging Approaches 16. Other Books You May Enjoy

Summary

Well done on completing this long and useful topic on tracing within the Linux kernel. We began this chapter with an overview of the many available tracing mechanisms on the Linux kernel – the first couple of figures nicely summarized this. A large portion of this chapter dealt with how you can leverage the powerful ftrace kernel infrastructure. It is high-performance and minimally invasive, with pretty much no dependencies, making it ideal for even constrained embedded systems!

To make it easier though, several useful frontends for ftrace exist. We covered using trace-cmd, the KernelShark GUI, and the perf-tools project. We finished the chapter with an introduction to using LTTng for kernel tracing and the Trace Compass GUI for visualizing the trace.

You'll tend to find that one tracing/visualization tool may be superior to another in some respects but is inferior in others. This, of course, is very typical (of pretty much everything – trade-offs,...

lock icon The rest of the chapter is locked
Register for a free Packt account to unlock a world of extra content!
A free Packt account unlocks extra newsletters, articles, discounted offers, and much more. Start advancing your knowledge today.
Unlock this book and the full library FREE for 7 days
Get unlimited access to 7000+ expert-authored eBooks and videos courses covering every tech area you can think of
Renews at $19.99/month. Cancel anytime
Banner background image