Pinning work item query data
In TFS, you are able to create queries using Work Item Query Language (WIQL) over all the work items in your team project collection. From these queries, you are able to pin some information to your dashboard to surface the results of those queries. There are two types of work item query data that you can pin to your dashboard:
- Work item query counts
- Work item query charts
Pinning work item query counts to the dashboard
Navigate to a query and click on the little arrow to the left of the query item in the query explorer. This will pop up a context menu. Click on Pin to homepage, as shown in this screenshot:

Figure 2: Pinning a query to the dashboard
After you have clicked on Pin to homepage, you will notice that the query now has a pinned icon next to it.
Note
This is slightly different from TFS 2013, where you would add queries to Team favorites and then that would make them show up on the team's dashboard.
Now, if you navigate back to the dashboard by clicking on HOME and then on Overview (if it is not open by default already), you will notice that there is a new tile on the dashboard for this query.
Blue tiles are for queries, and they display a count of the work items returned from a particular query. These tiles are clickable and will take you to that query in the queries tab if you click on them.
Pinning work item query charts
Before we can pin a query chart to the dashboard, we need to create the chart.
Note
Currently, you can only create charts for flat-list queries.
The easiest way to do this is by clicking on the tile on the dashboard from the query that we created earlier. This will take us to the query results view. Click on Charts, as follows:

Figure 3: Query results
You will notice that by default, there are no charts for a query. To create a new chart, click on the New Chart button, as shown here:

Figure 4: Creating the first chart
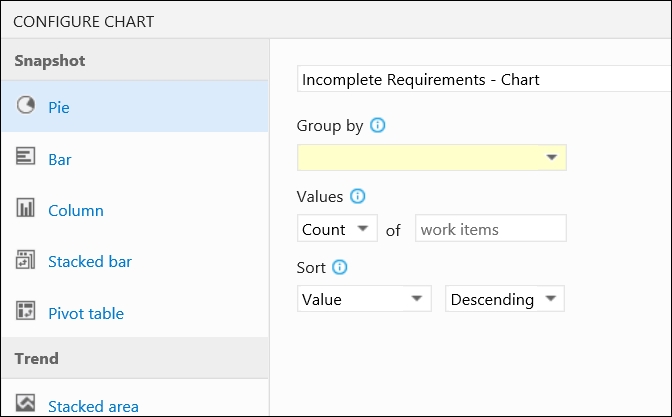
This will open up the CONFIGURE CHART dialog, as shown in the following screenshot:

Figure 5: The CONFIGURE CHART dialog
You are able to select how the chart orders its values. Commonly, this is ordering by Value or Label. For this field I prefer using label, the main reason being that when it's pinned, it's easier to consume the information in the charts because the same label value appears in the same place in the chart. In the case where the chart would be consumed once off, it would be a better solution to sort by value.
Note
The options that show up in the drop-down lists, such as Group by in the Pie, Bar and Column charts, come from the columns that are shown in your query. So, if you have a custom field, such as Department, and you want to use that field in your chart, you will need to make sure that it is visible in the query results.
For now, we have all the columns we need, so let's select State for Group by, add by State to our title, and then click on OK, like this:

Figure 6: Saving a pie chart that is grouped by State
Now, we have created a chart and it shows as a saved chart for this query. From here, we can simply click on the ellipsis and then click on Pin to homepage, as shown in this screenshot:

Figure 7: Pinning the chart to the home page
Visually, nothing will change on this page, letting you know that it is now on the home page. However, if you click on the ellipsis again, you will see that it now says Unpin from homepage, like this:

Figure 8: Unpinning a chart from the home page
If we navigate back to the home page now, we will see that our chart is visible as well.
You pinned a basic query and a basic chart to the dashboard, but you can imagine with the various chart types available how much insight this can give to a team with just a glance on their dashboard. You can get more information about charts from MSDN by going to https://msdn.microsoft.com/Library/vs/alm/Report/charts.


