Debugging with IntelliTrace
IntelliTrace is a great tool to make the debugging process more efficient; it creates a stream of detailed application events from many framework components, which can be replayed after they've occurred, allowing us to go back in time and debug the application. IntelliTrace is only available in Ultimate versions of Visual Studio; if you don't have Visual Studio Ultimate, you can get a 3-month trial to try this feature if you like.
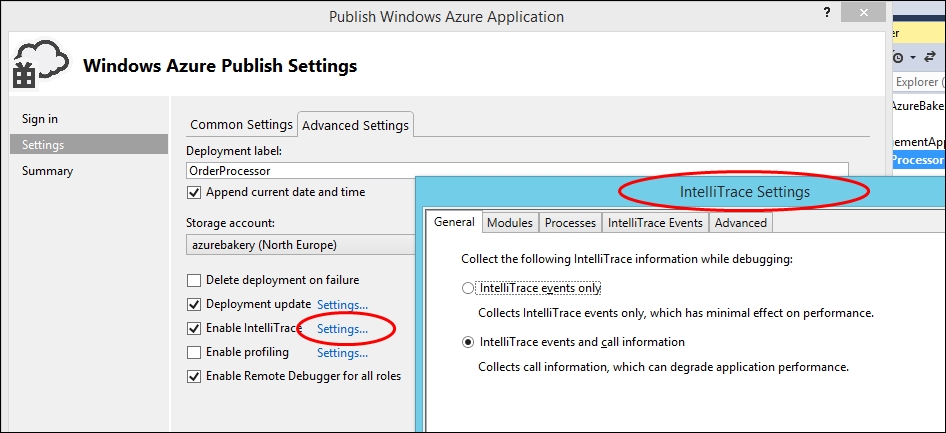
To get started, we need to enable IntelliTrace in the Advanced Settings tab during the publish step. We can adjust the IntelliTrace Settings by clicking on the Settings… link next to the Enable IntelliTrace checkbox:

Tip
As with all diagnostic data, we need to be careful while using IntelliTrace as we can quickly build up large amounts of data in storage, which we will be charged for. We can control the maximum amount of data stored by navigating to the IntelliTrace Settings | Advanced tab, and the default value is 250 MB.
To view the IntelliTrace...


