Why Highcharts?
Although Highcharts only has the basic 2D charts, it offers very appealing and professional looking charts in the market. It is a product which stands out by paying attention to details, not only on the presentation side but also in other areas that are described later on. The product was released in late 2009 and developed by a Norwegian company called Highsoft Solutions AS, created and founded by Torstein Hønsi. Highcharts is not their first product, but by far their best selling one.
Highcharts and JavaScript frameworks
Although Highcharts is built with the JavaScript framework library, it is implemented in such a way that it doesn't totally rely on one particular framework. Highcharts is packaged with adapters, to make its interfaces to framework, pluggable.
As a result, Highcharts can be incorporated under MooTools, Prototype, or jQuery JavaScript frameworks. This empowers users without compromising their already developed product or allows them to decide on using the framework which is best suited to their projects. Highcharts uses jQuery as the default framework implementation, hence it only requires users to load the jQuery library before Highcharts.
To use Highcharts under the MooTools environment, users simply do the following:
<script src="//ajax.googleapis.com/ajax/libs/mootools/1.4.5/mootools-yui-compressed.js"></script>
<script type="text/javascript"
        src="Highcharts-2.2.2/js/adapters/mootools-adapter.js"></script>
<script type="text/javascript"
        src="Highcharts-2.2.2/js/highcharts.js"></script>
And to use Highcharts under Prototype, users need to do the following:
<script src="//ajax.googleapis.com/ajax/libs/prototype/1.7.1.0/prototype.js"></script>
<script type="text/javascript"
        src="Highcharts-2.2.2/js/adapters/prototype-adapter.js"></script>
<script type="text/javascript"
        src="Highcharts-2.2.2/js/highcharts.js"></script>
Presentation
Highcharts strikes the right balance of look and feel. The charts themselves are visually pleasant and yet the style is simple. The default choices of color are soothing without a sharp contrast conflicting each other, which is aided by the subtle shadow and white border effects. None of the text nor the colors of the axes are in black or any dark color, which keeps the viewers' attention centered to the colored data presentation.

All the animations (initial, update, tooltip) in Highcharts are finely tuned—smooth with a gradual slowdown motion. For instance, the initial animation of the donut chart, which is a multiseries pie chart, is the most impressive one. This is the area where Highcharts is clearly better; the animations in other charts are too mechanical, too much, and sometimes off-putting.

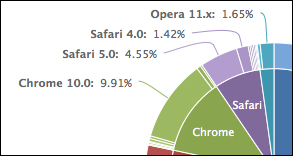
The round corners of tooltip and legends (both inner and outer) with a simple border do not fight for the viewers' attention and nicely blend inside the chart. The following is a tooltip sample:

The following is a legend example with two series:

In a nutshell, every element in Highcharts does not compete with each other for viewers' attention; they share the load equally and work together as a chart.
License
Highcharts has free noncommercial as well as commercial licenses. The free license for personal and nonprofit purposes is Creative Commons – Attribution NonCommercial 3.0. Highcharts offers different flavors of commercial licenses for different purposes. They have a one-off single website license and, thankfully, developer licenses. For web development products, a developer license is a better model than charging in units of website basis or a very high priced OEM license because of the following reasons:
It is easy for the software companies to work out the math in their development plans
There is less worry regarding how many copies are being sold, so as to not violate the license
As usual, the developer license does not automatically grant the use of Highcharts indefinitely. The license only permits the unlimited use of all the versions released within a year from the license purchase date. Thereafter, an update license is required if developers decide to use a newer version and so on. Moreover, any condition can be negotiated for the OEM license, and most commonly, the quote is based on the number of developers on the project and the number of deployments.
Simple API model
Highcharts has a very simple API model. For creating a chart, the constructor API expects an object specifier with all the necessary settings. As for dynamically updating an existing chart, Highcharts comes with a small set of APIs. The configuration properties are described in detail in Chapter 2, Highcharts Configurations. The API calls are discussed in Chapter 7, Highcharts APIs.
Documentations
Highcharts' online documentation is one of the areas that really outshines the others. It is not just a simple documentation page to dump all the definitions and examples. It's a documentation page built with thought. Here is why.
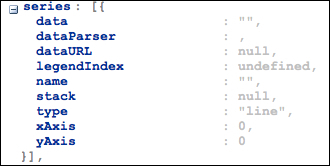
The left-hand side of the documentation page is organized in an object structure as how you would pass it to create a chart. You can expand and collapse the object's attributes further like in a JavaScript console. This has helped the users to become familiar with the product by using it naturally.

The well thought out part of the documentation is on the right-hand side with the definitions of the attributes. Each definition comes with a description and an online demonstration for each setting linking to the jsFiddle website.

This instant jsFiddle demo invites users to explore different property values and observes the effect on the chart. Hence, the whole documentation browsing process becomes very effective and fluid.
Openness (feature request with user voice)
One unusual way of how Highcharts decides new features for every major release is via the users' voice (this is not unusual in open source project practices but it is one of the areas where Highcharts is better than the others). Users can submit new feature requests and then vote for them. The company then reviews the feature requests with the highest votes and draws up a development plan for the new features. The details of the plan are then published on the Highcharts website.
In addition, Highcharts is hosted on GitHub, an online public source control service, which allows JavaScript developers to contribute and clone their own versions.


