GeoJSON in Leaflet.js
GeoJSON is just another data format for you to add to your map. It can be added as a hardcoded variable. Leaflet.js geometries—markers, polylines, and polygons—can be converted to GeoJSON. You can style the data, apply options to each feature, and even filter the data. The next sections will cover these topics, starting with adding GeoJSON as a hardcoded variable.
GeoJSON as a variable
The easiest way to add GeoJSON to your map is to hardcode the data into a variable. In Leaflet.js, you will start by creating a variable that will contain GeoJSON. In the following code, GeoJSON data consisting of two points is assigned to the geojson variable:
vargeojson = [{
"type": "Feature",
"geometry": {
"type": "Point",
"coordinates": [-106.62987,35.10418]
},
"properties": {
"name": "My Point",
"title": "A point at the Big I"
}
},{
"type": "Feature",
"geometry": {
"type": "Point",
"coordinates": [-106, 35]
},
"properties": {
"name": "My Other Point",
"title": "A point near Moriarty and I40"
}
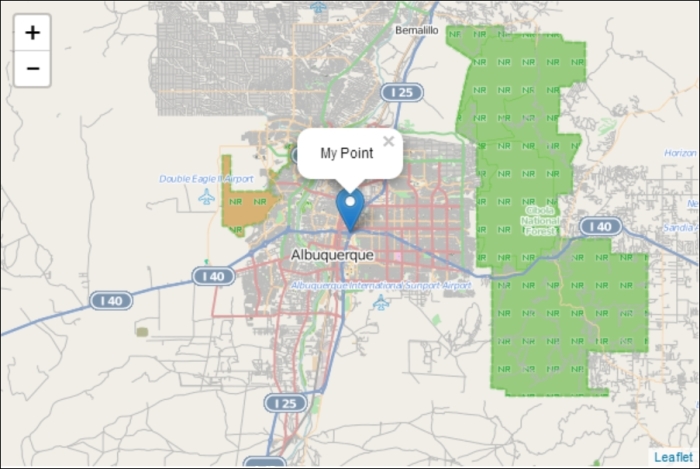
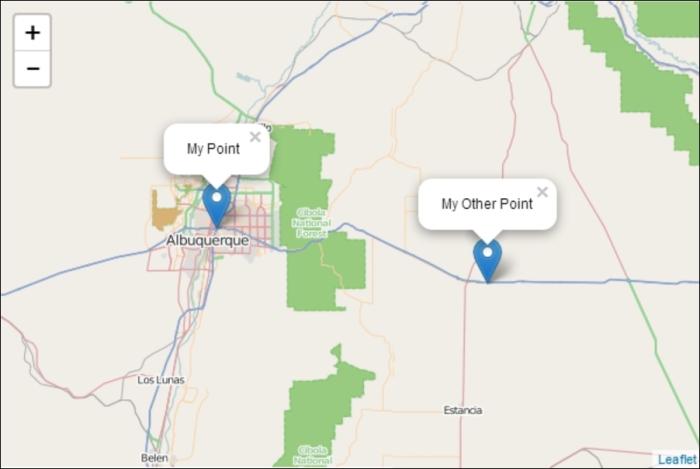
}];Once you have the GeoJSON data in a variable, as shown in the preceding code, adding it to the map is no different from adding any other geometry you have learned so far. The following code adds GeoJSON to the map:
vargeoJsonLayer = L.geoJson(geojson).addTo(map);
The preceding code creates a geoJsonLayer variable. This variable is an instance of the L.geoJson()class. It takes a variable with the GeoJSON data as a parameter and then you chain .addTo(map) to the end.
Note
Objects have been created using (latitude, longitude) in Chapter 1, Creating Maps with Leaflet; however, note that in GeoJSON, the format is (longitude, latitude).
The result of this code will be a map with two markers, as shown in the following screenshot:
Multiple geometries in GeoJSON
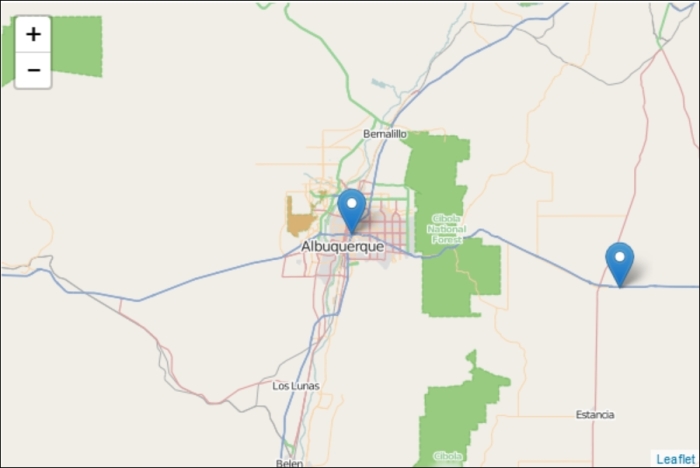
In the preceding example, GeoJSON contained only points. While it is common for a GeoJSON file to contain a single geographic feature, it is not a requirement. Leaflet.js can load GeoJSON with multiple geometries in a single GeoJSON file. In this example, you will learn how to create and add a GeoJSON file with a point, line string, and polygon. The following GeoJSON code contains three different geometries:
vargeojson = [{
"type": "Feature",
"geometry": {
"type": "Point",
"coordinates": [-106.62987, 35.10418]
          },
  "properties": {
  "name": "My Point",
         "title": "A point at the Big I"
        }
},{
"type": "Feature",
  "geometry": {
      "type": "LineString",
        "coordinates":[[-106.67999, 35.14097],
                        [-106.68892, 35.12974],
  [-106.69064, 35.1098]]
               },
"properties": {
      "name": "My LineString",
      "title": "A line along the Rio Grande"
                  }
},{
"type": "Feature",
  "geometry": {
      "type": "Polygon",
       "coordinates":[[[-106.78059, 35.14574],
           [-106.7799, 35.10559],
           [-106.71467, 35.13704],
           [-106.69716, 35.17942],
           [-106.78059, 35.14574]]]
               },
"properties": {
      "name": "My Polygon",
      "title": "Balloon Fiesta Park"
                  }
 }];
To create different geometries in a single GeoJSON file, you just need to specify the type and include the proper coordinates, as shown in the preceding code. For a line string, you must include at least two points. In Leaflet.js, polygons do not require you to close them by including the starting coordinates at the end of the list. GeoJSON does require you to close the polygon. The polygon in the preceding code starts and ends with [-106.78059, 35.14574]. The preceding code will produce the map shown in the following screenshot:
Polygons with holes
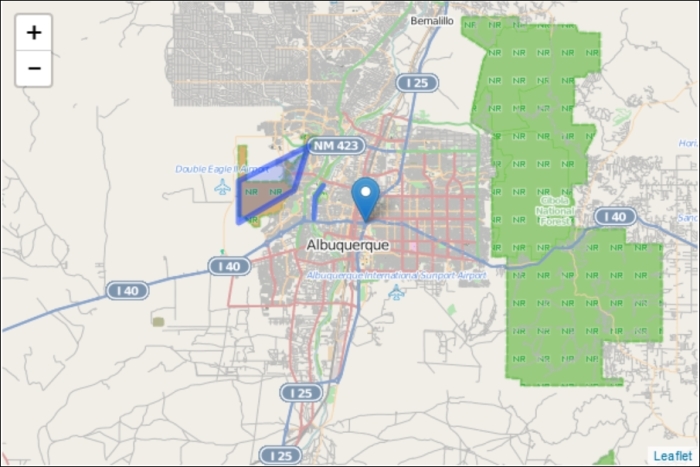
A polygon in GeoJSON can be a donut, that is, you can cut a polygon out of the middle of another polygon. The following code shows you a polygon feature with two polygons, the outer and inner polygons:
vargeojson = [{
"type": "Feature",
  "geometry": {
      "type": "Polygon",
       "coordinates":[
           [[-106.875, 35.20074],
            [-106.82281, 34.9895],
            [-106.50146, 35.00525],
            [-106.47949, 35.1985],
            [-106.875, 35.20074]],
  [[-106.6745, 35.1463],
 [-106.70403, 35.05192],
 [-106.55296, 35.05979],
 [-106.53854, 35.17212],
 [-106.6745, 35.1463]]
   ]
               },
"properties": {
      "name": "My Polygon with a hole",
       "title": "Donut"
                  }
            }];
In the preceding code, the first set of points creates a four-sided polygon. The second set of points—the next level of indentation—creates a four-sided polygon in the middle of the first polygon. The result is shown in the following screenshot:
The middle of the polygon in the preceding screenshot is hollow. If you add a pop up to the polygon, it will only open when you click on the blue ring.
GeoJSON from Leaflet.js objects
Each of the geometries you learned about in Chapter 1, Creating Maps with Leaflet, have a toGeoJson() method. This method will convert the geometry to a GeoJSON object that can be added to the map. The following code shows you how to convert a marker to a GeoJSON layer:
varmyMarker=L.marker([35.10418, -106.62987]);
varmarkerAsGeoJSON = myMarker.toGeoJSON();
vargeoJsonLayer = L.geoJson(markerAsGeoJSON).addTo(map);
The preceding code creates a marker, as you did in the Adding data to your map section in Chapter 1, Creating Maps with Leaflet. Secondly, it calls the .toGeoJSON() method, which returns a GeoJSON object and stores it as markerAsGeoJSON. Lastly, markerAsGeoJSON is added to the map as GeoJSON.
Styling GeoJSON layers
GeoJSON layers have a style option and a setStyle() method. Using the style option, you specify a function that will style the layer. The following code shows you how to style a GeoJSON layer with the style option:
functionstyleFunction(feature){
switch (feature.properties.type) {
case 'LineString': return {color: "red"}; break;
case 'Polygon':   return {color: "purple"}; break;
        }
}
vargeoJsonLayer = L.geoJson(geojson,{style:styleFunction}).addTo(map);
The preceding code creates a style function that returns a color based on the GeoJSON feature names. If it is a line string, it is colored red, and if it is a polygon, it is colored purple.
Note
You can also style the GeoJSON data using other options such as stroke, weight, opacity, and fillColor. The full list is available at http://leafletjs.com/reference.html#path-options.
The last line creates the GeoJSON layer, calls the style function, and then adds it to the map. The result is seen in the following screenshot:
The setStyle() method allows you to change the style after one has already been applied or by using events. The following code shows you how an event can call the setStyle() method to update the color of the GeoJSON layer:
functionstyleFunction(){return {color: "purple"}; }
functionnewStyle(){geoJsonLayer.setStyle({color:"green"});}

vargeoJsonLayer = L.geoJson(geojson,{style:styleFunction}).addTo(map);
geoJsonLayer.on('mouseover',newStyle);
geoJsonLayer.on('mouseout',function(e){geoJsonLayer.resetStyle(e.target);});
The preceding code first creates a function called styleFunction(), which is called in the fourth line of code using the style option as shown in the previous example. It sets the color of the GeoJSON layer to purple. Next, there is another function, newStyle(), which sets the color to green. Lastly, there are two events: mouseover and mouseout. When the user hovers over the GeoJSON layer, the newStyle() function is called and the layer is colored green. As soon as the mouse moves off the layer, an anonymous function is called. This function uses the GeoJSON method, resetStyle(), to pass the target of the event—the GeoJSON layer—and changes the layer back to its original style.
Consider the following example code:
function styleFunction(){return {color: "purple"}; }
function newStyle(){geoJsonLayer.setStyle({color:"green"});}
function oldStyle(){geoJsonLayer.setStyle({color:"purple"});}
var geoJsonLayer = L.geoJson(geojson,{style:styleFunction}).addTo(map);
geoJsonLayer.on('mouseover',newStyle);geoJsonLayer.on('mouseout',oldStyle);
The preceding code first creates a function called styleFunction(), which is called in the fourth line of code using the style option as shown in the previous example. It sets the color of the GeoJSON layer to purple. Next, there are two other functions: newStyle() and oldStyle(). The former sets the color to green and the latter returns the color back to the original purple. Lastly, there are two events that call the style functions: mouseover and mouseout. When the user hovers over the GeoJSON layer, the newStyle() function is called and the layer is colored green. As soon as the mouse moves off the layer, oldStyle() is called and the color is set back to purple.
Iterating through the features
In Leaflet.js, you can iterate through the features in a GeoJSON file and perform actions on it before it is added to the map. This can be done with the onEachFeature, pointToLayer, or filter option.
Attaching pop ups with onEachFeature
The GeoJSON layer in Leaflet.js has an onEachFeature option, which is called for every feature in the data. This can be used to bind a pop up to each feature as it is added to the map. The following code uses the onEachFeature option to bind a pop up:
L.geoJson(geojson, {
onEachFeature: function(feature,layer) {
layer.bindPopup(feature.properties.title);
    }
}).addTo(map);
In the preceding code, an anonymous function is called on each feature. The function binds a pop up in line three with the value of the feature's title property. You can select any one of a feature's properties using feature.properties.NameOfProperty. The result is shown in the following screenshot:
Creating layers from points with pointToLayer
The pointToLayer option works with points, as they are handled differently as compared to polylines and polygons. In the following code, a marker is created and styled for each feature based on the name of the feature:
var options2 = {
draggable: false,
title: "A point near Moriarty and I40"
};
var x;
var y;
L.geoJson(geojsonFeature, {
pointToLayer: function(feature,latlng) {
switch (feature.properties.name) {
case "My Point": x = L.marker(latlng,{draggable:true,title:"A point at the
   Big I"}).bindPopup(feature.properties.name); return x;
case "My Other Point":  y =
L.marker(latlng,options2).bindPopup(feature.properties.name);
return y;
        }
    }
}).addTo(map);
The preceding code starts by creating a JSON variable that holds the style information. Next, the layers on which the markers will be created are created as x and y. Then, the GeoJSON layer is created and the pointToLayer option is called with an anonymous function. The function has a switch statement that styles the markers based on their name property. The first case statement has the property information added at the creation of the marker. The second case statement passes the JSON variable with the style information. Both work, so if you have a style that you want to apply to all your features, you can write it once in a variable and call it during the creation of the marker. Because the code assigned the layers to variables x and y, you can add or remove layers using map.removeLayer(x).
Displaying a subset of data with filter
There might be times when you load in GeoJSON from an outside source and you do not want to display all the features in the data. Filtering will allow you to not display certain features based on criteria that you set. Modifying the case statement in the previous point-to-layer example, you will learn how to filter data based on the name of the feature. The following code shows you how to do this:
L.geoJson(geojsonFeature, {
filter: function(feature,latlng) {
switch (feature.properties.name) {
case "My Point": return true;
case "My Other Point":  return false;
        }
    }
}).addTo(map);
The preceding code should look similar to the previous examples. You create the GeoJSON layer and then pass the filter option. The option uses an anonymous function. The function, in this case, is a switch statement that takes the name of the feature as a parameter. Since the function is deciding on whether or not to display a feature, the return value is a Boolean. In this example, if the name of the feature is My Other Point, it will not be displayed. The following screenshot shows you the result; only one marker is added to the map: