Search icon CANCEL
Subscription
0
Cart icon
Your Cart (0 item)
Close icon
You have no products in your basket yet
Save more on your purchases! discount-offer-chevron-icon
Savings automatically calculated. No voucher code required.
Arrow left icon
Explore Products
Best Sellers
New Releases
Books
Videos
Audiobooks
Learning Hub
Free Learning
Arrow right icon
Arrow up icon
GO TO TOP
DevOps for Web Development

You're reading from   DevOps for Web Development Achieve the Continuous Integration and Continuous Delivery of your web applications with ease

Arrow left icon
Product type Paperback
Published in Oct 2016
Publisher Packt
ISBN-13 9781786465702
Length 408 pages
Edition 1st Edition
Languages
Tools
Concepts
Arrow right icon
Author (1):
Arrow left icon
Mitesh Soni Mitesh Soni
Author Profile Icon Mitesh Soni
Mitesh Soni
Arrow right icon
View More author details
Toc

Table of Contents (10) Chapters Close

Preface 1. Getting Started – DevOps Concepts, Tools, and Technologies FREE CHAPTER 2. Continuous Integration with Jenkins 2 3. Building the Code and Configuring the Build Pipeline 4. Installing and Configuring Chef 5. Installing and Configuring Docker 6. Cloud Provisioning and Configuration Management with Chef 7. Deploying Application in AWS, Azure, and Docker 8. Monitoring Infrastructure and Applications 9. Orchestrating Application Deployment

Monitoring AWS Elastic Beanstalk


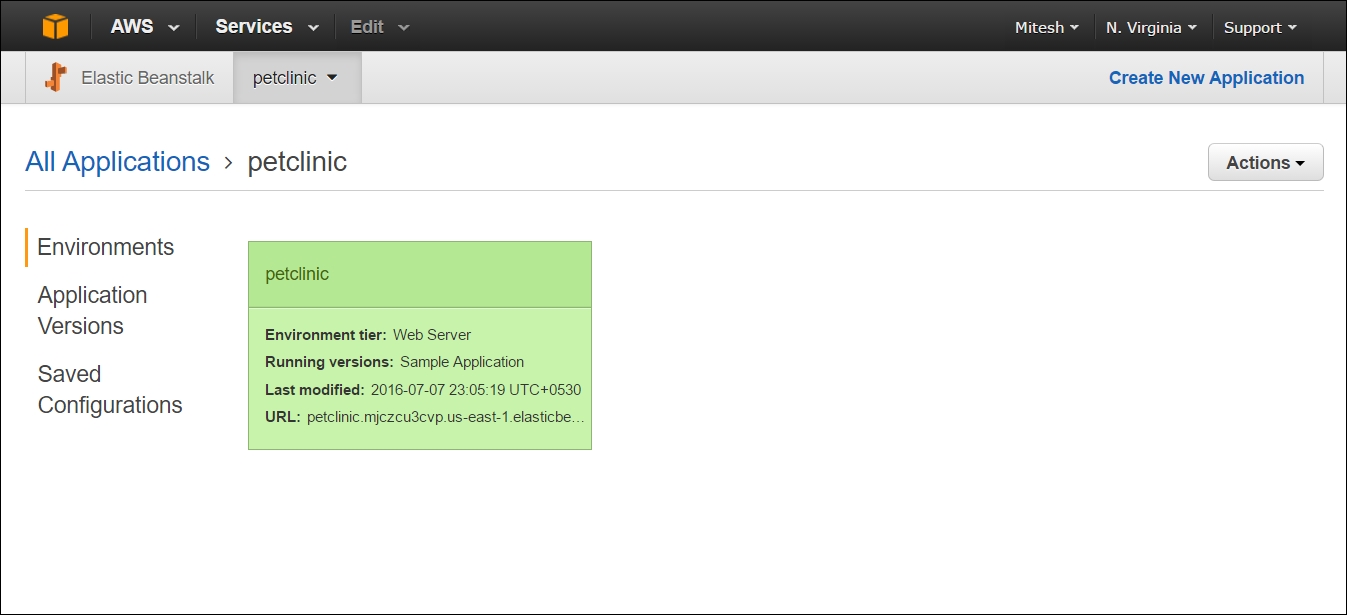
We have deployed PetClinic Application in to AWS Elastic Beanstalk as well with the use of Jenkins plugin. In AWS Elastic Beanstalk, health status of an environment is determined by Grey, Green, Yellow, and Red color. Grey indicates that environment is in the process of updation. Green indicates successful health check status in recent times. Yellow indicates that environment has failure of one or more Health checks. Red indicates that environment has failure of three or more Health checks.

Health status is based on the response of an application running in the Environments:
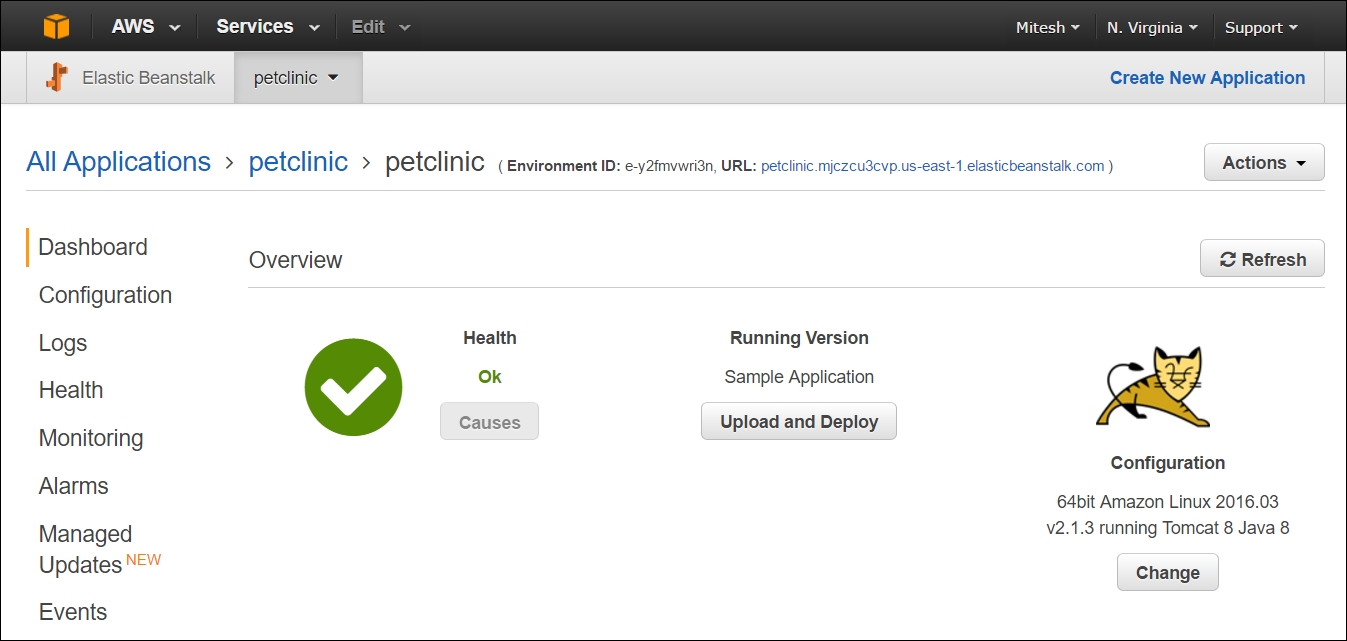
On the Environment dashboard in AWS Elastic Beanstalk, we get basic details such as Health as well as configuration of instances:
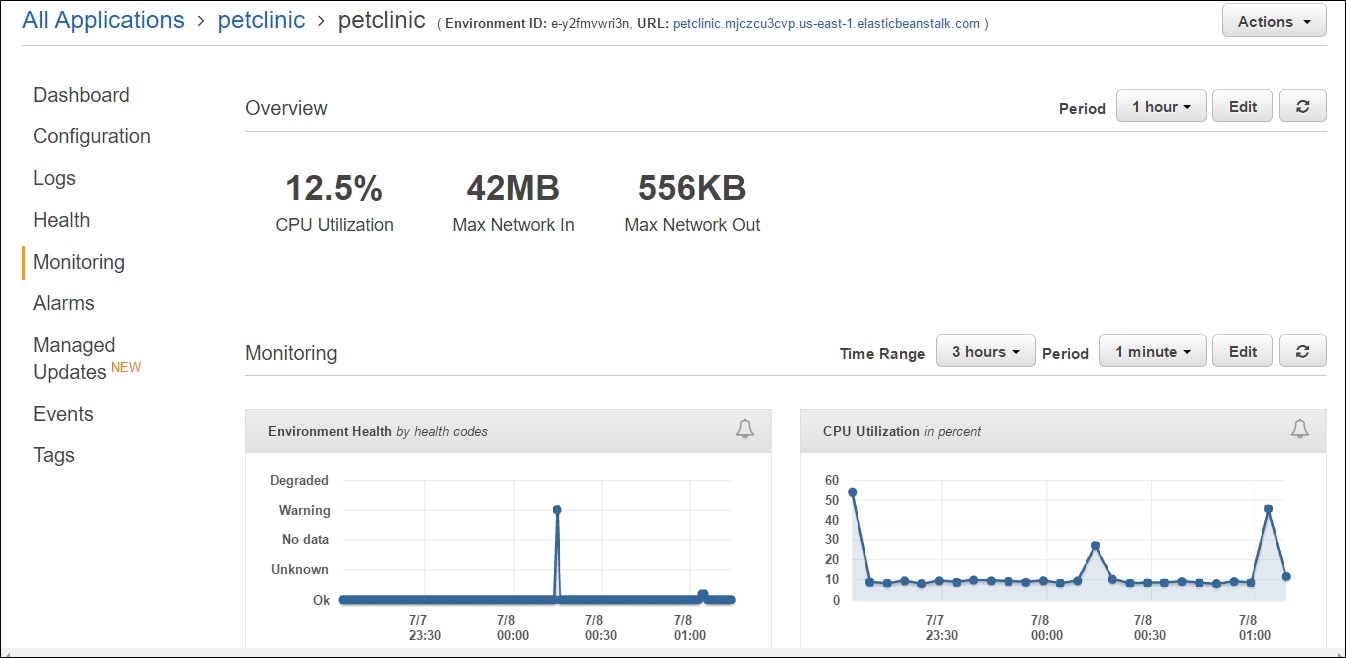
Click on the Monitoring for extensive monitoring details in form of CPU Utilization and Health of an application. We can change Time Range to get more details on Monitoring:
Note

For more information on monitoring AWS Elastic Beanstalk, visit http://docs.aws...

lock icon The rest of the chapter is locked
Register for a free Packt account to unlock a world of extra content!
A free Packt account unlocks extra newsletters, articles, discounted offers, and much more. Start advancing your knowledge today.
Unlock this book and the full library FREE for 7 days
Get unlimited access to 7000+ expert-authored eBooks and videos courses covering every tech area you can think of
Renews at $19.99/month. Cancel anytime
Banner background image