Initially known as IPython, this project was initiated in 2001 as a free project by Fernando Perez. By his work, the author intended to address a lack in the Python stack and provide to the public a user programming interface for data investigations that could easily incorporate the scientific approach (mainly meaning experimenting and interactively discovering) in the process of data discovery and software development.
A scientific approach implies fast experimentation of different hypotheses in a reproducible fashion (as does data exploration and analysis in data science), and when using this interface, you will be able more naturally to implement an explorative, iterative, trial and error research strategy during your code writing.
Recently (during Spring 2015), a large part of the IPython project was moved to a new one called Jupyter. This new project extends the potential usability of the original IPython interface to a wide range of programming languages, such as these:
- R (https://github.com/IRkernel/IRkernel)
- Julia (http://github.com/JuliaLang/IJulia.jl)
- Scala (https://github.com/mattpap/IScala)
For a more complete list of available kernels for Jupyter, please visit https://github.com/ipython/ipython/wiki/IPython-kernels-for-other-languages.
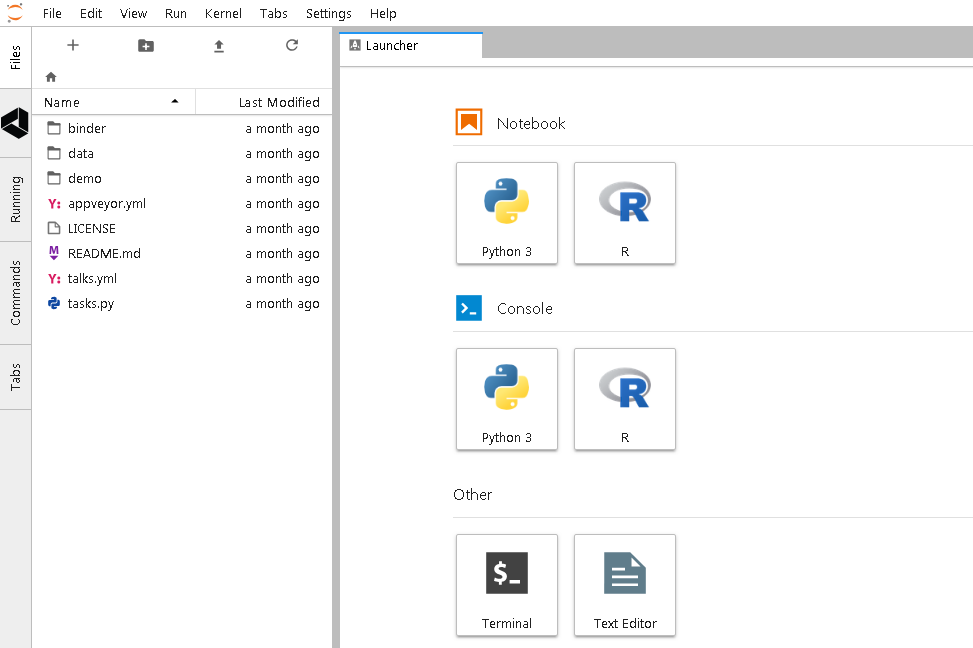
For instance, once having installed Jupyter and its IPython kernel, you can easily add another useful kernel, such as the R kernel, in order to access the R language through the same interface. All you have to do is have an R installation, run your R interface, and enter the following commands:
install.packages(c('pbdZMQ', 'devtools'))
devtools::install_github('IRkernel/repr')
devtools::install_github('IRkernel/IRdisplay')
devtools::install_github('IRkernel/IRkernel')
IRkernel::installspec()
The commands will install the devtools library on your R, then pull and install all the necessary libraries from GitHub (you need to be connected to the internet while running the other commands), and finally register the R kernel both in your R installation and on Jupyter. After that, every time you call the Jupyter Notebook, you will have the choice of running either a Python or an R kernel, allowing you to use the same format and approach for all your data science projects.
Thanks to the powerful idea of kernels, programs that run the user's code that's communicated by the frontend interface and provide feedback on the results of the executed code to the interface itself, you can use the same interface and interactive programming style no matter what language you are using for development.
In such a context, IPython is the zero kernel, the original starting one, still existing but not intended to be used anymore to refer to the entire project.
Therefore, Jupyter can simply be described as a tool for interactive tasks that are operable by a console or by a web-based notebook, which offers special commands that help developers to better understand and build the code that is being currently written.
Contrary to an IDE—which is built around the idea of writing a script, running it afterward, and finally evaluating its results—Jupyter lets you write your code in chunks, named cells, run each of them sequentially, and evaluate the results of each one separately, examining both textual and graphical outputs. Besides graphical integration, it provides you with further help, thanks to customizable commands, a rich history (in the JSON format), and computational parallelism for an enhanced performance when dealing with heavy numeric computations.
Such an approach is also particularly fruitful for tasks involving developing code based on data, since it automatically accomplishes the often neglected duty of documenting and illustrating how data analysis has been done, its premises and assumptions, and its intermediate and final results. If a part of your job is to also present your work and persuade an internal or external stakeholder in the project, Jupyter can really do the magic of storytelling for you with little additional effort.
You can easily combine code, comments, formulas, charts, interactive plots, and rich media such as images and videos, making each Jupyter Notebook a complete scientific sketchpad to find all your experimentations and their results together.
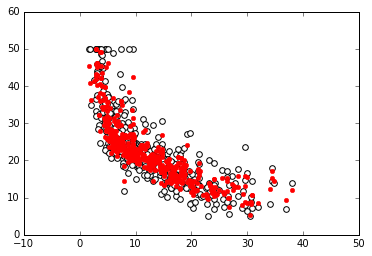
Jupyter works on your favorite browser (which could be Explorer, Firefox, or Chrome, for instance) and, when started, presents a cell waiting for code to be written in. Each block of code enclosed in a cell can be run, and its results are reported in the space just after the cell. Plots can be represented in the notebook (inline plot) or in a separate window. In our example, we decided to plot our chart inline.
Moreover, written notes can be written easily using the Markdown language, a very easy and fast-to-grasp markup language (http://daringfireball.net/projects/markdown/). Math formulas can be handled using MathJax (https://www.mathjax.org/) to render any LaTeX script inside HTML/markdown.
There are several ways to insert LaTeX code in a cell. The easiest way is to simply use the Markdown syntax, wrapping the equations with a single dollar sign, $, for an inline LaTeX formula, or with a double dollar sign, $$, for a one-line central equation. Remember that to have a correct output, the cell should be set as Markdown. Here's an example:
In Markdown:
This is a $LaTeX$ inline equation: $x = Ax+b$

And this is a one-liner: $$x = Ax + b$$
This produces the following output:

If you're looking for something more elaborate, that is, a formula that spans for more than one line, a table, a series of equations that should be aligned, or simply the use of special LaTeX functions, then it's better to use the %%latex magic command offered by the Jupyter Notebook. In this case, the cell must be in code mode and contain the magic command as the first line. The following lines must define a complete LaTeX environment that can be compiled by the LaTeX interpreter.
Here are a couple of examples that show you what you can do:
In:%%latex
   [
    |u(t)| =
     begin{cases}
      u(t) & text{if } t geq 0 \
      -u(t)       & text{otherwise }
     end{cases}
   ]
Here is the output of the first example:

In:%%latex
   begin{align}
   f(x) &= (a+b)^2 \
        &= a^2 + (a+b) + (a+b) + b^2 \
        &= a^2 + 2cdot (a+b) + b^2
   end{align}
The new output when the second example is run is:


Remember that by using the %%latex magic command, the whole cell must comply with the LaTeX syntax. Therefore, if you just need to write a few simple equations in the text, we strongly advise that you use the Markdown method (a text-to-HTML conversion tool for web writers developed by John Gruber, with the help of Aaron Swartz: https://daringfireball.net/projects/markdown/).
Being able to integrate technical formulas in markdown is particularly fruitful for tasks involving the development of code based on data since it automatically accomplishes the often neglected duty of documenting and illustrating how data analysis has been managed as well as its premises, assumptions, and intermediate and final results. If a part of your job is to also present your work and persuade internal or external stakeholders in the project, Jupyter can really do the magic of storytelling for you with little additional effort.
On the web page https://github.com/ipython/ipython/wiki/A-gallery-of-interesting-IPython-Notebooks, there are many examples, some of which you may find inspiring for your work, as it did for ours. Actually, we have to confess that keeping a clean, up-to-date Jupyter Notebook has saved us uncountable times when meeting with managers and stakeholders have suddenly popped up, requiring us to present the state of our work hastily.
In short, Jupyter allows you to do the following:
- See intermediate (debugging) results for each step of the analysis
- Run only some sections (or cells) of the code
- Store intermediate results in JSON format and have the ability to perform version control on them
- Present your work (this will be a combination of text, code, and images), share it via the Jupyter Notebook Viewer service (http://nbviewer.jupyter.org/), and easily export it into HTML, PDF, or even slideshows
In the next section, we will discuss Jupyter's installation in more detail and show an example of its usage in a data science task.


