Questions
- Use the
scikit-imagelibrary's functions to read a collection of images and display them as a montage. - Use the
scipy ndimageandmiscmodules' functions to zoom, crop, resize, and apply Affine transformation to an image. - Create a Python remake of the Gotham Instagram filter (https://github.com/lukexyz/CV-Instagram-Filters) (hint: manipulate an image with the PIL
split(),merge(), andnumpy interp()functions to create a channel interpolation (https://www.youtube.com/watch?v=otLGDpBglEA&feature=player_embedded)). - Use scikit-image's
warp()function to implement the swirl transform. Note that theswirltransform can also be expressed with the following equations:


- Implement the wave transform (hint: use scikit-image's
warp()) given by the following:


- Use PIL to load an RGB
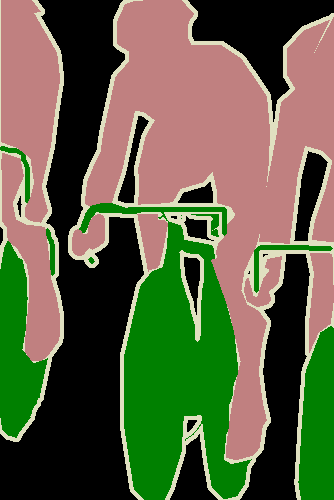
.pngfile with a palette and convert into a grayscale image. This problem is taken from this post: https://stackoverflow.com/questions/51676447/python-use-pil-to-load-png-file-gives-strange-results/51678271#51678271. Convert the following RGB image (from theVOC2012dataset) into a grayscale image by indexing the palette:
- Make a 3D plot for each of the color channels of the parrot image used in this chapter (hint: use the
mpl_toolkits.mplot3dmodule'splot_surface()function and NumPy'smeshgrid()function).
- Use scikit-image's
transformmodule'sProjectiveTransformto estimate the homography matrix from a source to a destination image and use theinverse()function to embed the Lena image (or yours) in the blank canvas as shown in the following:
Input Image | Output Image |
 |  |
First try to solve the problems on your own. For your reference, the solutions can be found here: https://sandipanweb.wordpress.com/2018/07/30/some-image-processing-problems/.