


Working with packages
Robust, performant, and numerous though base R functions are, we are by no means limited to them! Additional functionality is available in the form of packages. In fact, what makes R such a formidable statistics platform is the astonishing wealth of packages available (over 10,000 at the time of writing). R's ecosystem is second to none!
Most of these myriad packages exist on the Comprehensive R Archive Network (CRAN). CRAN is the primary repository for user-created packages.
One package that we are going to start using right away is the ggplot2 package. ggplot2 is a plotting system for R. Base R has sophisticated and advanced mechanisms to plot data, but many find ggplot2 more consistent and easier to use. Further, the plots are often more aesthetically pleasing by default.
Let's install it:
  > # downloads and installs from CRAN
  > install.packages("ggplot2")
Now that we have the package downloaded, let's load it into the R session and test it out by plotting our data from the last section:
  > library(ggplot2)
  > ggplot(favs, aes(x=flav, y=number)) +
  +    geom_bar(stat="identity") +
  +    ggtitle("Soy ice cream flavor preferences")
The graph generated by the preceding code will be as follows:
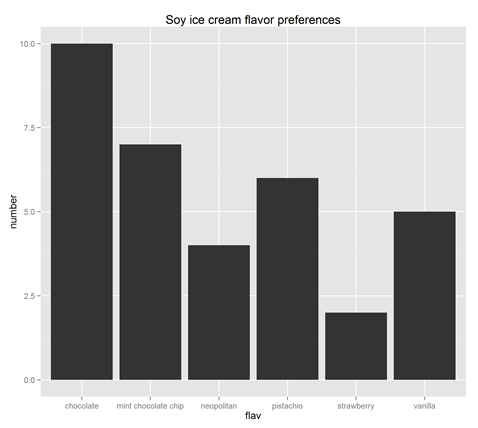
Figure 1.1: Soy ice cream flavor preferences
You're all wrong, Mint Chocolate Chip is way better!
Don't worry about the syntax of the ggplot function yet. We'll get to it in good time.
You will be installing some more packages as you work through this text. In the meantime, if you want to play around with a few more packages, you can install the gdata and foreign packages that allow you to directly import Excel spreadsheets and SPSS data files, respectively, directly into R.


