Unfortunately, the written code doesn't always work as expected. In such a case, it is a good idea to start debugging to see how the program operates, find the source of the problem, and correct it. This task is especially useful for complex algorithms, where the flow could be complicated, and therefore quite difficult to analyze just by reading the code. Fortunately, the IDE is equipped with various features for debugging that will be presented in this section.
First of all, let's launch the application to see it in action! To do so, you just need to select a proper configuration from the drop-down list (Debug, in this example) and click on the button with the green triangle and the Start caption in the main toolbar, or press F5. To stop debugging, you can choose Debug | Stop Debugging or press Shift + F5.
As already mentioned, there are various debugging techniques, but let's start with breakpoint-based debugging, since it is one of the most common approaches offering huge opportunities. You can place a breakpoint in any line of the code. The program will stop as soon as the line is reached, before executing it. Then, you can see the values of particular variables to check whether the application works as expected.
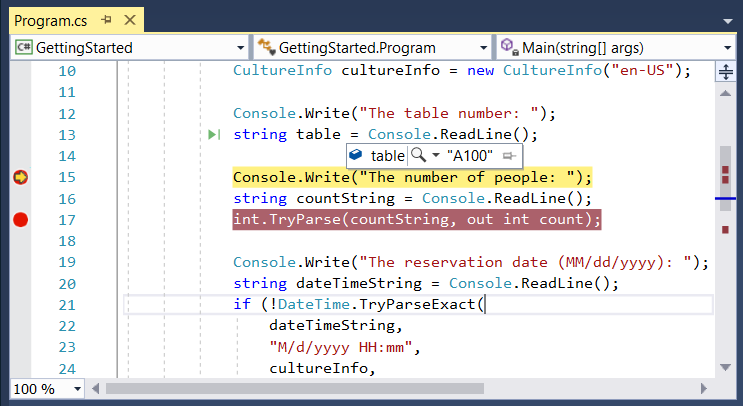
To add a breakpoint, you can either click on the left-hand margin (next to the line on which the breakpoint should be placed) or place the cursor on the line (where the breakpoint should be added) and press the F9 key. In both cases, the red circle will be shown, as well as the code from the given line will be marked with a red background, as shown in line 17 in the following screenshot:

When a line with the breakpoint is reached while executing the program, it stops, and the line is marked with the yellow background and the margin icon changes, as shown in line 15 in the screenshot. Now, you can check the value of the variable by simply moving the cursor over its name. The current value will appear in the ToolTip.
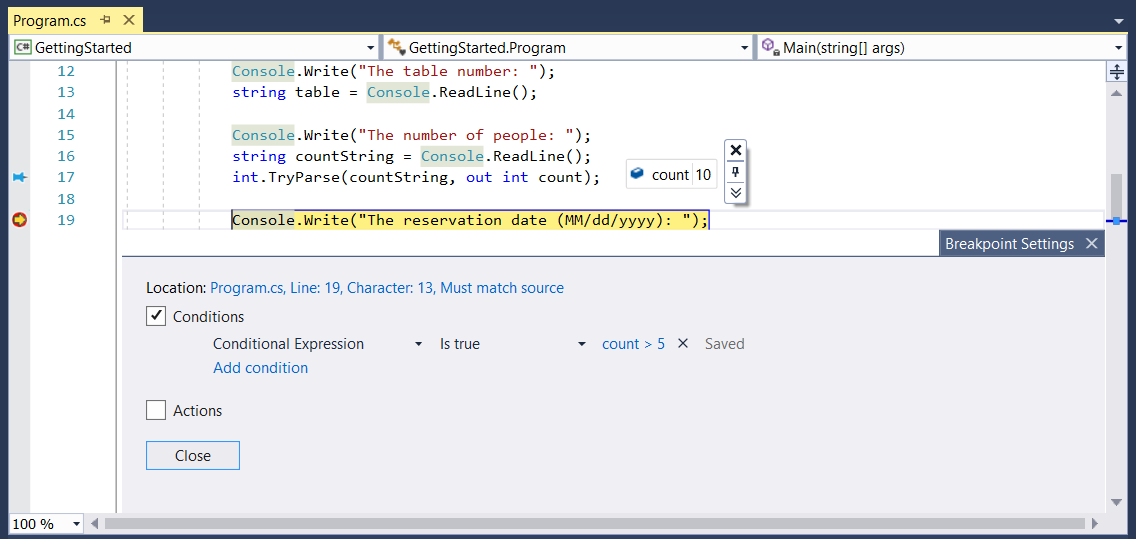
You can also click on the pin icon located on the right-hand side of the ToolTip to pin it in the editor. Its value will then be visible without the necessity of moving the cursor over the name of the variable. Such a value will be automatically refreshed as soon as it has changed. The result is presented in the following screenshot.
The IDE could adjust its appearance and features depending on the operations performed currently. For example, while debugging, you have access to some special windows, such as Locals, Call Stack, and Diagnostic Tools. The first shows available local variables together with their types and values. The Call Stack window presents information about the following called methods. The last one (namely Diagnostic Tools) shows information about memory and CPU usage, as well as events.
Moreover, the IDE supports conditional breakpoints that stop execution of the program only if the associated Boolean expression is evaluated to true. You can add a condition to a given breakpoint by choosing the Conditions option from the context menu, which is shown after right-clicking on the breakpoint icon in the left-hand margin. Then, the Breakpoint Settings window appears, where you should check the Conditions checkbox and specify the Conditional Expression, such as the one shown in the following screenshot. In the example, execution will stop only when the value of the count variable is greater than 5, that is, count > 5:

When the execution is stopped, you can use the step-by-step debugging technique. To move execution of the program to the next line (without incorporating another breakpoint), you can click on the Step Over icon in the main toolbar or press F10. If you want to step into the method, which is called in the line where the execution has stopped, just click on the Step Into button or press F11. Of course, you can also go to the next breakpoint by clicking on the Continue button or by pressing F5.
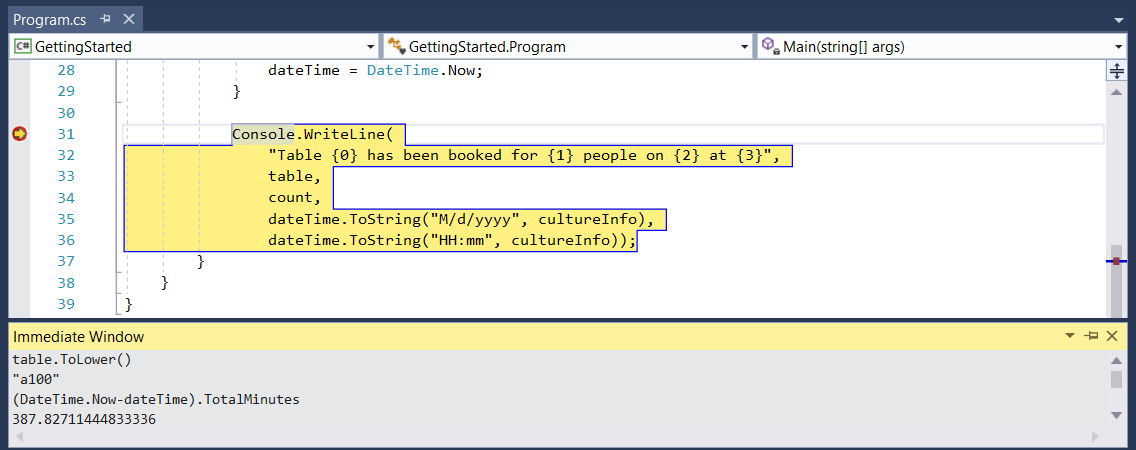
The next interesting feature, available in the IDE, is called Immediate Window. It allows developers to execute various expressions when the program execution is stopped using the current values of the variables. You just need to enter an expression in the Immediate Window and press the Enter key. The example is shown in the following screenshot:

Here, the lower-case version of the table number is returned by executing table.ToLower(). Then, the total number of minutes between the current date and the dateTime variable is calculated and shown in the window.


