Prerequisites – configuration settings
The Splunk command usually opens the Statistics tab by default when we run Splunk search queries over the web console. The following are generic steps to be taken to view the respective visualization on the Splunk Web dashboard. When we run a search command on Splunk, the results are shown in the Statistics tab, as shown in the following screenshot:

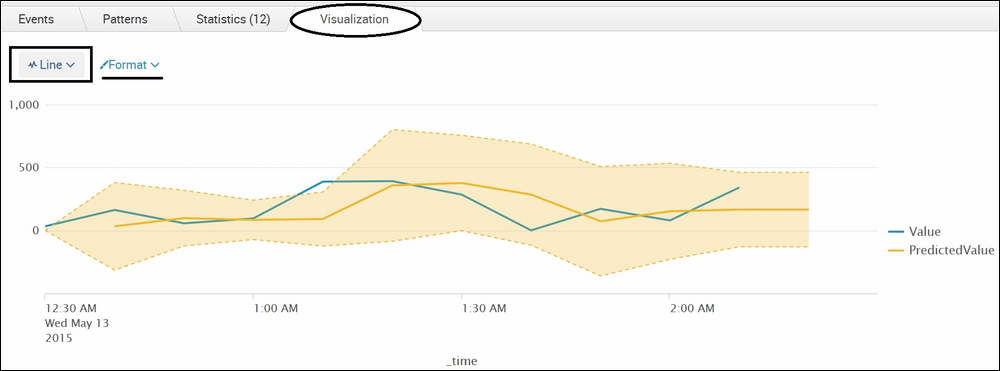
Once the output is available and a statistical command is used in the search query, when we click on the Visualization tab, the default visualization will be visible, as shown in the following screenshot. The top-left option, Format, can be used to format of the visualization:

The respective visualization can be chosen from the visualization picker (marked with a rectangular box in the preceding screenshot), which is available at the top-left corner of the Visualization tab. The following screenshot shows the default visualization available in Splunk, and apart from the following visualization, custom and...


