Adding a background to your dashboard
This recipe shows the usefulness of backgrounds in the dashboard. It will show how backgrounds can help provide additional depth to objects and help to group certain areas together for better visualization.
Getting ready
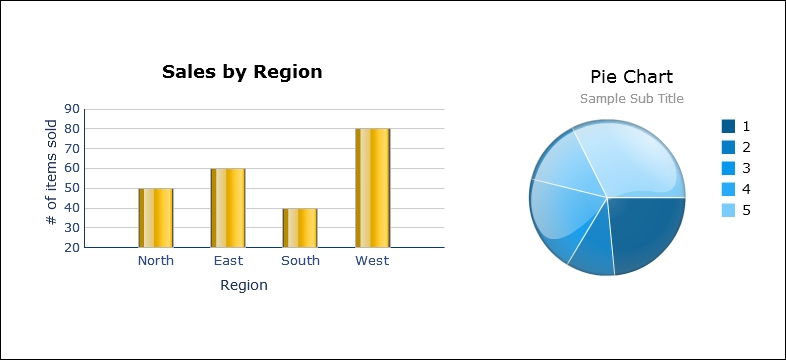
Make sure you have all your objects such as charts and selectors ready on the canvas. The following is an example of the two charts before the makeover. Bind some data to the charts if you want to change the coloring of the series.

How to do it...
Choose Background4 from the Art and Backgrounds tab of the Components window.

Stretch the background so that it fills the size of the canvas.
Make sure that the ordering of the backgrounds is behind the charts. To change the ordering of the background, go to the object browser, select the background object, and then press the - key until the background object is behind the chart.
Select Background from the Art and Backgrounds tab and put two of them under the charts, as shown in the following screenshot...


