Our first clusters
Kubernetes is supported on a variety of platforms and OSes. For the examples in this book, I used an Ubuntu 16.04 Linux VirtualBox (https://www.virtualbox.org/wiki/Downloads) for my client and Google Compute Engine (GCE) with Debian for the cluster itself. We will also take a brief look at a cluster running on Amazon Web Services (AWS) with Ubuntu.
Note
To save some money, both GCP (https://cloud.google.com/free/) and AWS (https://aws.amazon.com/free/) offer free tiers and trial offers for their cloud infrastructure. It's worth using these free trials for learning Kubernetes, if possible.
Most of the concepts and examples in this book should work on any installation of a Kubernetes cluster. To get more information on other platform setups, refer to the Kubernetes getting started page, which will help you pick the right solution for your cluster: http://kubernetes.io/docs/getting-started-guides/.
Running Kubernetes on GCE
We have a few options for setting up the prerequisites for our development environment. While we'll use a Linux client on our local machine in this example, you can also use the Google Cloud Shell to simplify your dependencies and setup. You can check out that documentation at https://cloud.google.com/shell/docs/, and then jump down to the gcloud auth login portion of the tutorial.
Getting back to the local installation, let's make sure that our environment is properly set up before we install Kubernetes. Start by updating the packages:
$ sudo apt-get updateYou should see something similar to the following output:
$ sudo apt update
[sudo] password for user:
Hit:1 http://archive.canonical.com/ubuntu xenial InRelease
Ign:2 http://dl.google.com/linux/chrome/deb stable InRelease
Hit:3 http://archive.ubuntu.com/ubuntu xenial InRelease
Get:4 http://security.ubuntu.com/ubuntu xenial-security InRelease [102 kB]
Ign:5 http://dell.archive.canonical.com/updates xenial-dell-dino2-mlk InRelease
Hit:6 http://ppa.launchpad.net/webupd8team/sublime-text-3/ubuntu xenial InRelease
Hit:7 https://download.sublimetext.com apt/stable/ InRelease
Hit:8 http://dl.google.com/linux/chrome/deb stable Release
Get:9 http://archive.ubuntu.com/ubuntu xenial-updates InRelease [102 kB]
Hit:10 https://apt.dockerproject.org/repo ubuntu-xenial InRelease
Hit:11 https://deb.nodesource.com/node_7.x xenial InRelease
Hit:12 https://download.docker.com/linux/ubuntu xenial InRelease
Ign:13 http://dell.archive.canonical.com/updates xenial-dell InRelease
<SNIPPED...>
Fetched 1,593 kB in 1s (1,081 kB/s)
Reading package lists... Done
Building dependency tree
Reading state information... Done
120 packages can be upgraded. Run 'apt list --upgradable' to see them.
$
Install Python and curl if they are not present:
$ sudo apt-get install python
$ sudo apt-get install curl
Install the gcloud SDK:
$ curl https://sdk.cloud.google.com | bashNote
We will need to start a new shell before gcloud is on our path.
Configure your GCP account information. This should automatically open a browser, from where we can log in to our Google Cloud account and authorize the SDK:
$ gcloud auth loginNote
If you have problems with login or want to use another browser, you can optionally use the --no-launch-browser command. Copy and paste the URL to the machine and/or browser of your choice. Log in with your Google Cloud credentials and click Allow on the permissions page. Finally, you should receive an authorization code that you can copy and paste back into the shell, where the prompt will be waiting.
A default project should be set, but we can verify this with the following command:
$ gcloud config list projectWe can modify this and set a new default project with the following command. Make sure to use project ID and not project name, as follows:
$ gcloud config set project <PROJECT ID>Note
We can find our project ID in the console at the following URL: https://console.developers.google.com/project. Alternatively, we can list the active projects with $ gcloud alpha projects list.
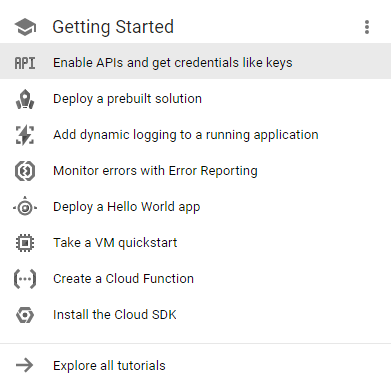
You can turn on API access to your project at this point in the GCP dashboard, https://console.developers.google.com/project, or the Kubernetes script will prompt you to do so in the next section:
Next, you want to change to a directory when you can install the Kubernetes binaries. We'll set that up and then download the software:
$ mkdir ~/code/gsw-k8s-3
$ cd ~/code/gsw-k8s-3
Installing the latest Kubernetes version is done in a single step, as follows:
$ curl -sS https://get.k8s.io | bashIt may take a minute or two to download Kubernetes depending on your connection speed. Earlier versions would automatically call the kube-up.sh script and start building our cluster. In version 1.5, we will need to call thekube-up.shscript ourselves to launch the cluster. By default, it will use the Google Cloud and GCE:
$ kubernetes/cluster/kube-up.shIf you get an error at this point due to missing components, you'll need to add a few pieces to your local Linux box. If you're running the Google Cloud Shell, or are utilizing a VM in GCP, you probably won't see this error:
$ kubernetes_install cluster/kube-up.sh...
Starting cluster in us-central1-b using provider gce
... calling verify-prereqs
missing required gcloud component "alpha"
missing required gcloud component "beta"
$
You can see that these components are missing and are required for leveraging the kube-up.sh script:
$ gcloud components list
Your current Cloud SDK version is: 193.0.0
The latest available version is: 193.0.0
┌─────────────────────────────────────────────────────────────────────────────────────────────────────────────┐
│ Components │
├───────────────┬──────────────────────────────────────────────────────┬──────────────────────────┬───────────┤
│ Status │ Name │ ID │ Size │
├───────────────┼──────────────────────────────────────────────────────┼──────────────────────────┼───────────┤
│ Not Installed │ App Engine Go Extensions │ app-engine-go │ 151.9 MiB │
│ Not Installed │ Cloud Bigtable Command Line Tool │ cbt │ 4.5 MiB │
│ Not Installed │ Cloud Bigtable Emulator │ bigtable │ 3.7 MiB │
│ Not Installed │ Cloud Datalab Command Line Tool │ datalab │ < 1 MiB │
│ Not Installed │ Cloud Datastore Emulator │ cloud-datastore-emulator │ 17.9 MiB │
│ Not Installed │ Cloud Datastore Emulator (Legacy) │ gcd-emulator │ 38.1 MiB │
│ Not Installed │ Cloud Pub/Sub Emulator │ pubsub-emulator │ 33.4 MiB │
│ Not Installed │ Emulator Reverse Proxy │ emulator-reverse-proxy │ 14.5 MiB │
│ Not Installed │ Google Container Local Builder │ container-builder-local │ 3.8 MiB │
│ Not Installed │ Google Container Registry's Docker credential helper │ docker-credential-gcr │ 3.3 MiB │
│ Not Installed │ gcloud Alpha Commands │ alpha │ < 1 MiB │
│ Not Installed │ gcloud Beta Commands │ beta │ < 1 MiB │
│ Not Installed │ gcloud app Java Extensions │ app-engine-java │ 118.9 MiB │
│ Not Installed │ gcloud app PHP Extensions │ app-engine-php │ │
│ Not Installed │ gcloud app Python Extensions │ app-engine-python │ 6.2 MiB │
│ Not Installed │ gcloud app Python Extensions (Extra Libraries) │ app-engine-python-extras │ 27.8 MiB │
│ Not Installed │ kubectl │ kubectl │ 12.3 MiB │
│ Installed │ BigQuery Command Line Tool │ bq │ < 1 MiB │
│ Installed │ Cloud SDK Core Libraries │ core │ 7.3 MiB │
│ Installed │ Cloud Storage Command Line Tool │ gsutil │ 3.3 MiB │
└───────────────┴──────────────────────────────────────────────────────┴──────────────────────────┴───────────┘
To install or remove components at your current SDK version [193.0.0], run:
  $ gcloud components install COMPONENT_ID
  $ gcloud components remove COMPONENT_ID
To update your SDK installation to the latest version [193.0.0], run:
  $ gcloud components update
You can update the components by adding them to your shell:
$ gcloud components install alpha beta
Your current Cloud SDK version is: 193.0.0
Installing components from version: 193.0.0
┌──────────────────────────────────────────────┐
│ These components will be installed. │
├───────────────────────┬────────────┬─────────┤
│ Name │ Version │ Size │
├───────────────────────┼────────────┼─────────┤
│ gcloud Alpha Commands │ 2017.09.15 │ < 1 MiB │
│ gcloud Beta Commands │ 2017.09.15 │ < 1 MiB │
└───────────────────────┴────────────┴─────────┘
For the latest full release notes, please visit:
  https://cloud.google.com/sdk/release_notes
Do you want to continue (Y/n)? y
╔════════════════════════════════════════════════════════════╗
╠═ Creating update staging area ═╣
╠════════════════════════════════════════════════════════════╣
╠═ Installing: gcloud Alpha Commands ═╣
╠════════════════════════════════════════════════════════════╣
╠═ Installing: gcloud Beta Commands ═╣
╠════════════════════════════════════════════════════════════╣
╠═ Creating backup and activating new installation ═╣
╚════════════════════════════════════════════════════════════╝
Performing post processing steps...done.
Update done!
After you run the kube-up.sh script, you will see quite a few lines roll past. Let's take a look at them one section at a time:

Note
If your gcloud components are not up to date, you may be prompted to update them.
The preceding screenshot shows the checks for prerequisites, as well as making sure that all components are up to date. This is specific to each provider. In the case of GCE, it will verify that the SDK is installed and that all components are up to date. If not, you will see a prompt at this point to install or update:
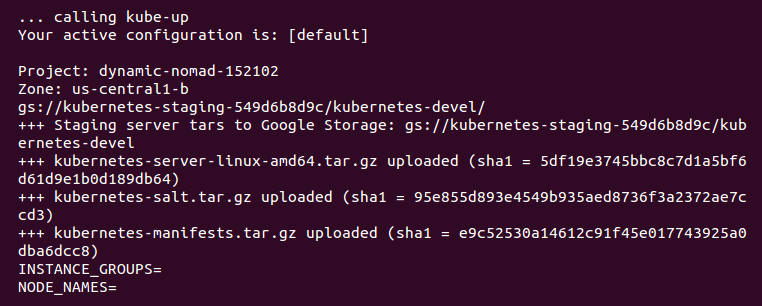
Now, the script is turning up the cluster. Again, this is specific to the provider. For GCE, it first checks to make sure that the SDK is configured for a default project and zone. If they are set, you'll see those in the output:
Note
You may see an output that the bucket for storage hasn't been created. That's normal! The creation script will go ahead and create it.
BucketNotFoundException: 404 gs://kubernetes-staging-22caacf417 bucket does not exist.
Next, it uploads the server binaries to Google Cloud storage, as seen in the Creating gs:... lines:
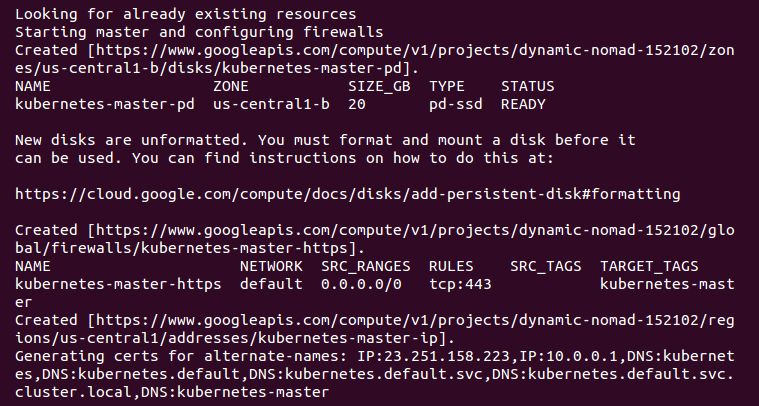
It then checks for any pieces of a cluster already running. Then, we finally start creating the cluster. In the output in the preceding screenshot, we can see it creating the master server, IP address, and appropriate firewall configurations for the cluster:
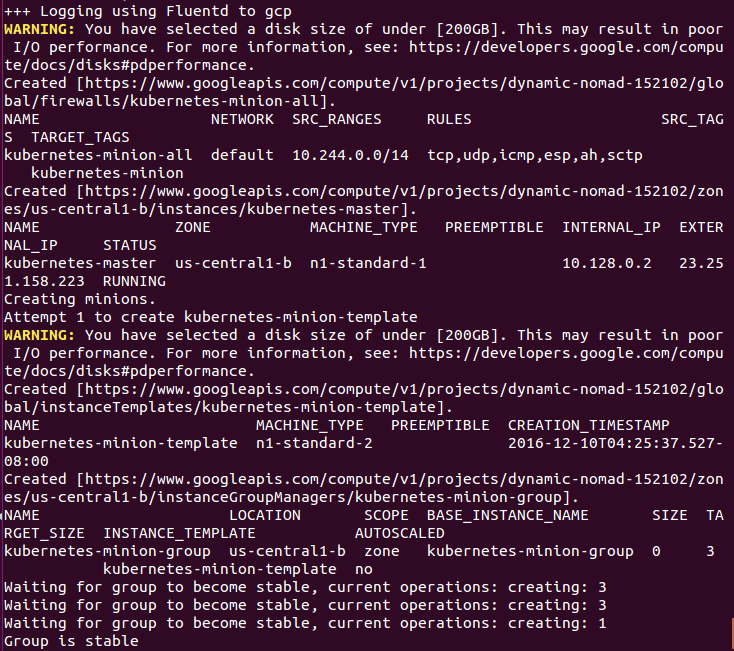
Finally, it creates the minions or nodes for our cluster. This is where our container workloads will actually run. It will continually loop and wait while all the minions start up. By default, the cluster will have four nodes (minions), but K8s supports having more than 1,000 (and soon beyond). We will come back to scaling the nodes later on in this book:
Attempt 1 to create kubernetes-minion-template
WARNING: You have selected a disk size of under [200GB]. This may result in poor I/O performance. For more information, see: https://developers.google.com/compute/docs/disks#performance.
Created [https://www.googleapis.com/compute/v1/projects/gsw-k8s-3/global/instanceTemplates/kubernetes-minion-template].
NAME MACHINE_TYPE PREEMPTIBLE CREATION_TIMESTAMP
kubernetes-minion-template n1-standard-2 2018-03-17T11:14:04.186-07:00
Created [https://www.googleapis.com/compute/v1/projects/gsw-k8s-3/zones/us-central1-b/instanceGroupManagers/kubernetes-minion-group].
NAME LOCATION SCOPE BASE_INSTANCE_NAME SIZE TARGET_SIZE INSTANCE_TEMPLATE AUTOSCALED
kubernetes-minion-group us-central1-b zone kubernetes-minion-group 0 3 kubernetes-minion-template no
Waiting for group to become stable, current operations: creating: 3
Group is stable
INSTANCE_GROUPS=kubernetes-minion-group
NODE_NAMES=kubernetes-minion-group-176g kubernetes-minion-group-s9qw kubernetes-minion-group-tr7r
Trying to find master named 'kubernetes-master'
Looking for address 'kubernetes-master-ip'
Using master: kubernetes-master (external IP: 104.155.172.179)
Waiting up to 300 seconds for cluster initialization.
Now that everything is created, the cluster is initialized and started. Assuming that everything goes well, we will get an IP address for the master:
... calling validate-cluster
Validating gce cluster, MULTIZONE=
Project: gsw-k8s-3
Network Project: gsw-k8s-3
Zone: us-central1-b
No resources found.
Waiting for 4 ready nodes. 0 ready nodes, 0 registered. Retrying.
No resources found.
Waiting for 4 ready nodes. 0 ready nodes, 0 registered. Retrying.
Waiting for 4 ready nodes. 0 ready nodes, 1 registered. Retrying.
Waiting for 4 ready nodes. 0 ready nodes, 4 registered. Retrying.
Found 4 node(s).
NAME STATUS ROLES AGE VERSION
kubernetes-master Ready,SchedulingDisabled <none> 32s v1.9.4
kubernetes-minion-group-176g Ready <none> 25s v1.9.4
kubernetes-minion-group-s9qw Ready <none> 25s v1.9.4
kubernetes-minion-group-tr7r Ready <none> 35s v1.9.4
Validate output:
NAME STATUS MESSAGE ERROR
etcd-1 Healthy {"health": "true"}
scheduler Healthy ok
controller-manager Healthy ok
etcd-0 Healthy {"health": "true"}
Cluster validation succeeded
Also, note that configuration along with the cluster management credentials are stored in home/<Username>/.kube/config.
Then, the script will validate the cluster. At this point, we are no longer running provider-specific code. The validation script will query the cluster via the kubectl.sh script. This is the central script for managing our cluster. In this case, it checks the number of minions found, registered, and in a ready state. It loops through, giving the cluster up to 10 minutes to finish initialization.
After a successful startup, a summary of the minions and the cluster component health is printed on the screen:
Done, listing cluster services:
Kubernetes master is running at https://104.155.172.179
GLBCDefaultBackend is running at https://104.155.172.179/api/v1/namespaces/kube-system/services/default-http-backend:http/proxy
Heapster is running at https://104.155.172.179/api/v1/namespaces/kube-system/services/heapster/proxy
KubeDNS is running at https://104.155.172.179/api/v1/namespaces/kube-system/services/kube-dns:dns/proxy
kubernetes-dashboard is running at https://104.155.172.179/api/v1/namespaces/kube-system/services/https:kubernetes-dashboard:/proxy
Metrics-server is running at https://104.155.172.179/api/v1/namespaces/kube-system/services/https:metrics-server:/proxy
Grafana is running at https://104.155.172.179/api/v1/namespaces/kube-system/services/monitoring-grafana/proxy
InfluxDB is running at https://104.155.172.179/api/v1/namespaces/kube-system/services/monitoring-influxdb:http/proxy
To further debug and diagnose cluster problems, use 'kubectl cluster-info dump'.
Finally, a kubectl cluster-info command is run, which outputs the URL for the master services, including DNS, UI, and monitoring. Let's take a look at some of these components.
If you'd like to get further debugging and/or diagnose cluster problems, you can use kubectl cluster-info dump to see what's going on with your cluster. Additionally, if you need to pause and take a break and want to conserve your free hours, you can log into the GUI and set the kubernetes-minion-group instance group to zero, which will remove all of the instances. The pencil will edit the group for you; set it to zero. Don't forget to set it back to three if you want to pick up again!
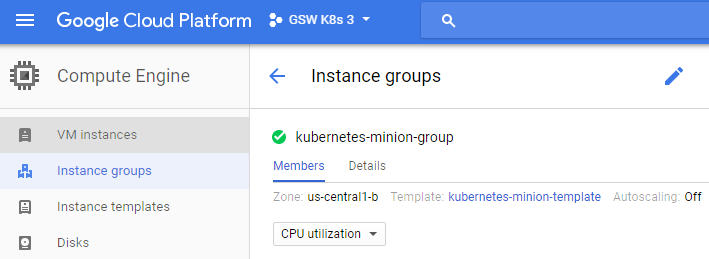
You can simply stop the manager as well. You'll need to click the stop button to shut it down:

If you'd like to start the cluster up again, start the servers again to keep going. They'll need some time to start up and connect to each other.
If you want to work on more than one cluster at a time or you want to use a different name than the default, see the <kubernetes>/cluster/gce/config-default.sh file for more fine-grained configuration of your cluster.
Kubernetes UI
Since Kubernetes v1.3.x, you can no longer authenticate through public IP addresses to the GUI. To get around this, we'll use the kubectl proxy command. First, grab the token from the configuration command, and then we'll use it to launch a local proxy version of the UI:
$ kubectl config view |grep token
 token: RvoYTIn4rExi1bNRzk56g0PU0srZbzOf
$ kubectl proxy --port=8001
Open a browser and enter the following URL: https://localhost/ui/.
Note
You can also type these commands to open a browser window automatically if you're on macOS: $ open https://localhost/ui/ or $ xdg-open https://localhost/ui if you're on Linux.
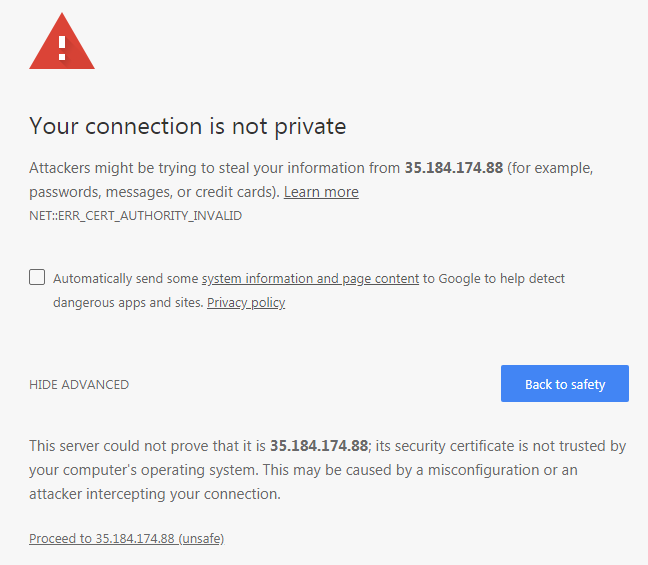
The certificate is self-signed by default, so you'll need to ignore the warnings in your browser before proceeding. After this, we will see a login dialog:
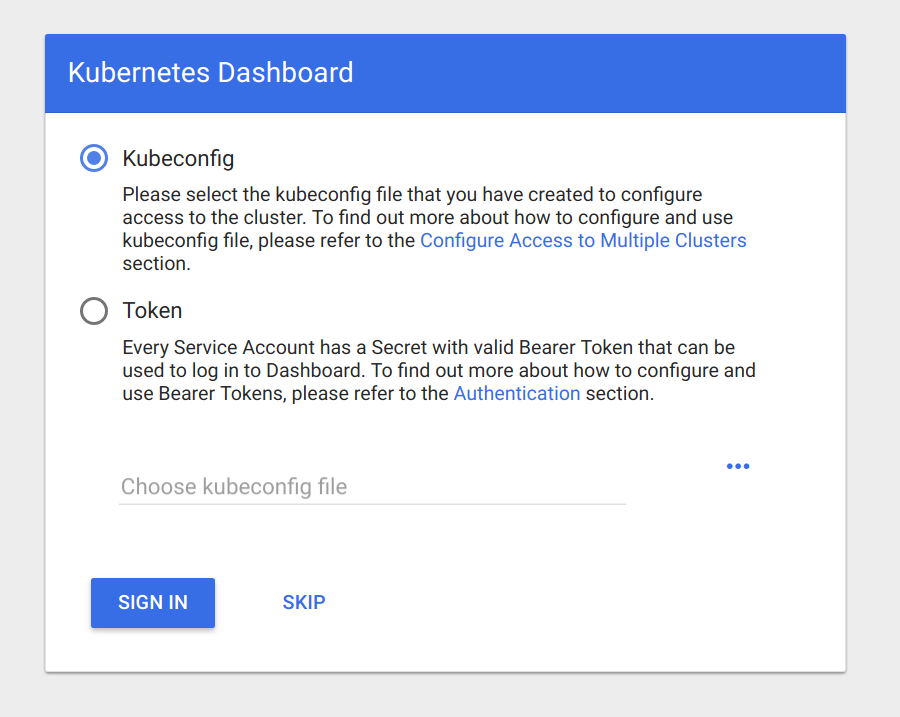
At this login dialog, you'll need to input the token that you grabbed in the aforementioned command.
Note
This is where we use the credentials listed during the K8s installation. We can find them at any time by simply using the config command $ kubectl config view.
Use the Token option and log in to your cluster:
Now that we have entered our token, you should see a dashboard like the one in the following screenshot:
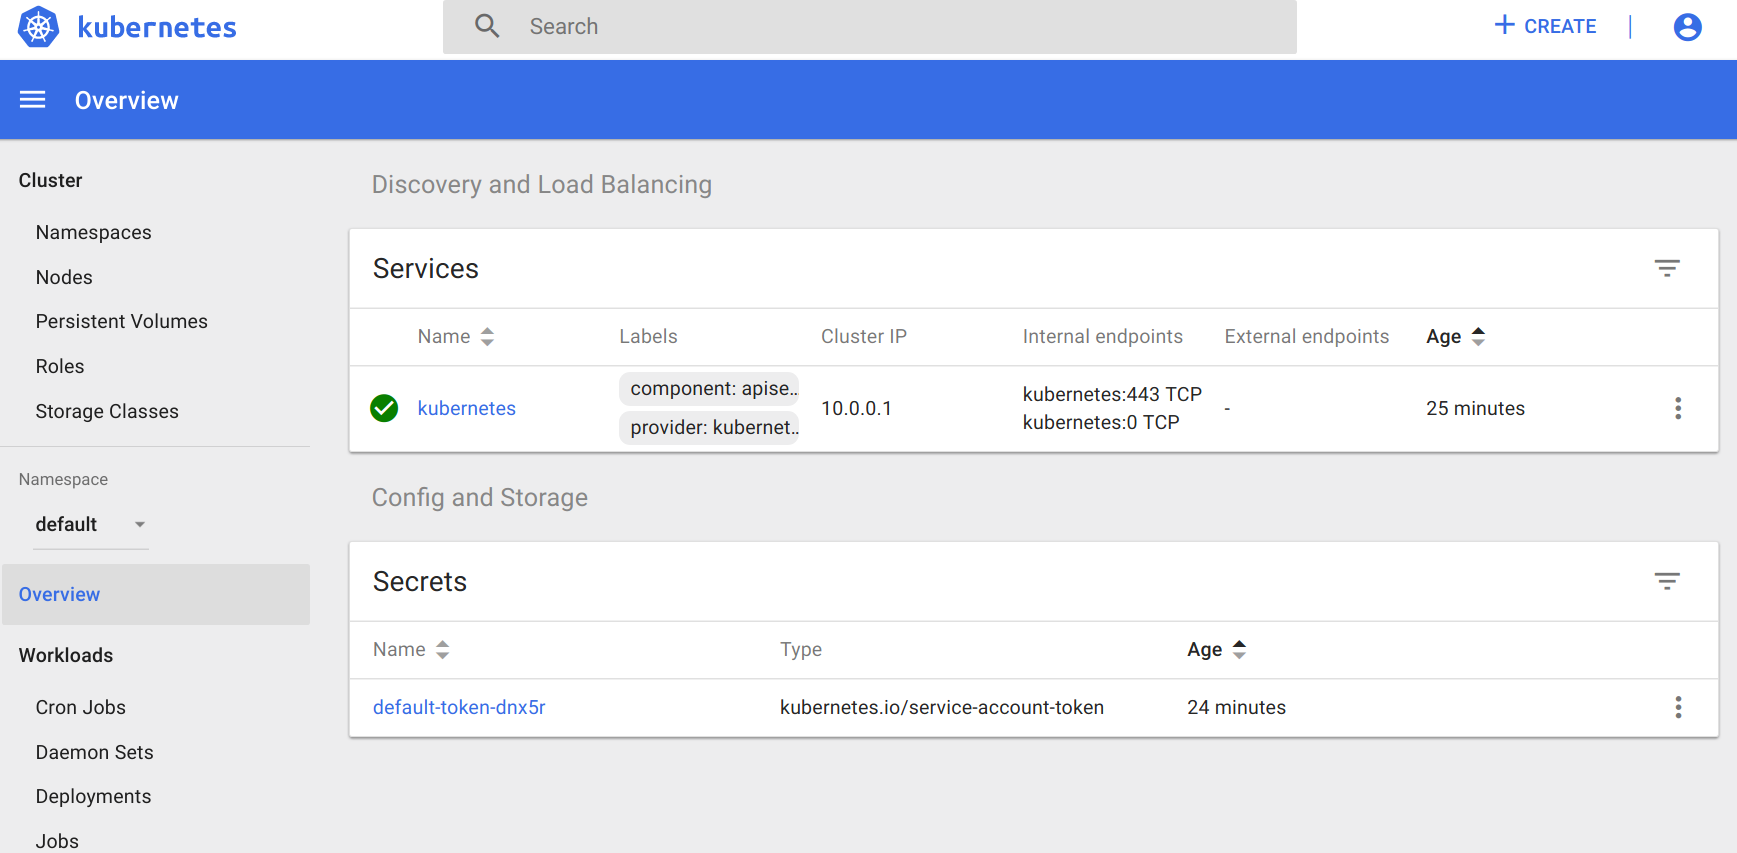
The main dashboard takes us to a page with not much display at first. There is a link to deploy a containerized app that will take you to a GUI for deployment. This GUI can be a very easy way to get started deploying apps without worrying about the YAML syntax for Kubernetes. However, as your use of containers matures, it's a good practice to use the YAML definitions that are checked in to source control.
If you click on the Nodes link on the left-hand side menu, you will see some metrics on the current cluster nodes:

At the top, we can see an aggregate of the CPU and memory use followed by a listing of our cluster nodes. Clicking on one of the nodes will take us to a page with detailed information about that node, its health, and various metrics.
The Kubernetes UI has a lot of other views that will become more useful as we start launching real applications and adding configurations to the cluster.
Grafana
Another service installed by default is Grafana. This tool will give us a dashboard to view metrics on the cluster nodes. We can access it using the following syntax in a browser:
https://localhost/api/v1/proxy/namespaces/kube-system/services/monitoring-grafana
The Grafana dashboard should look like this:
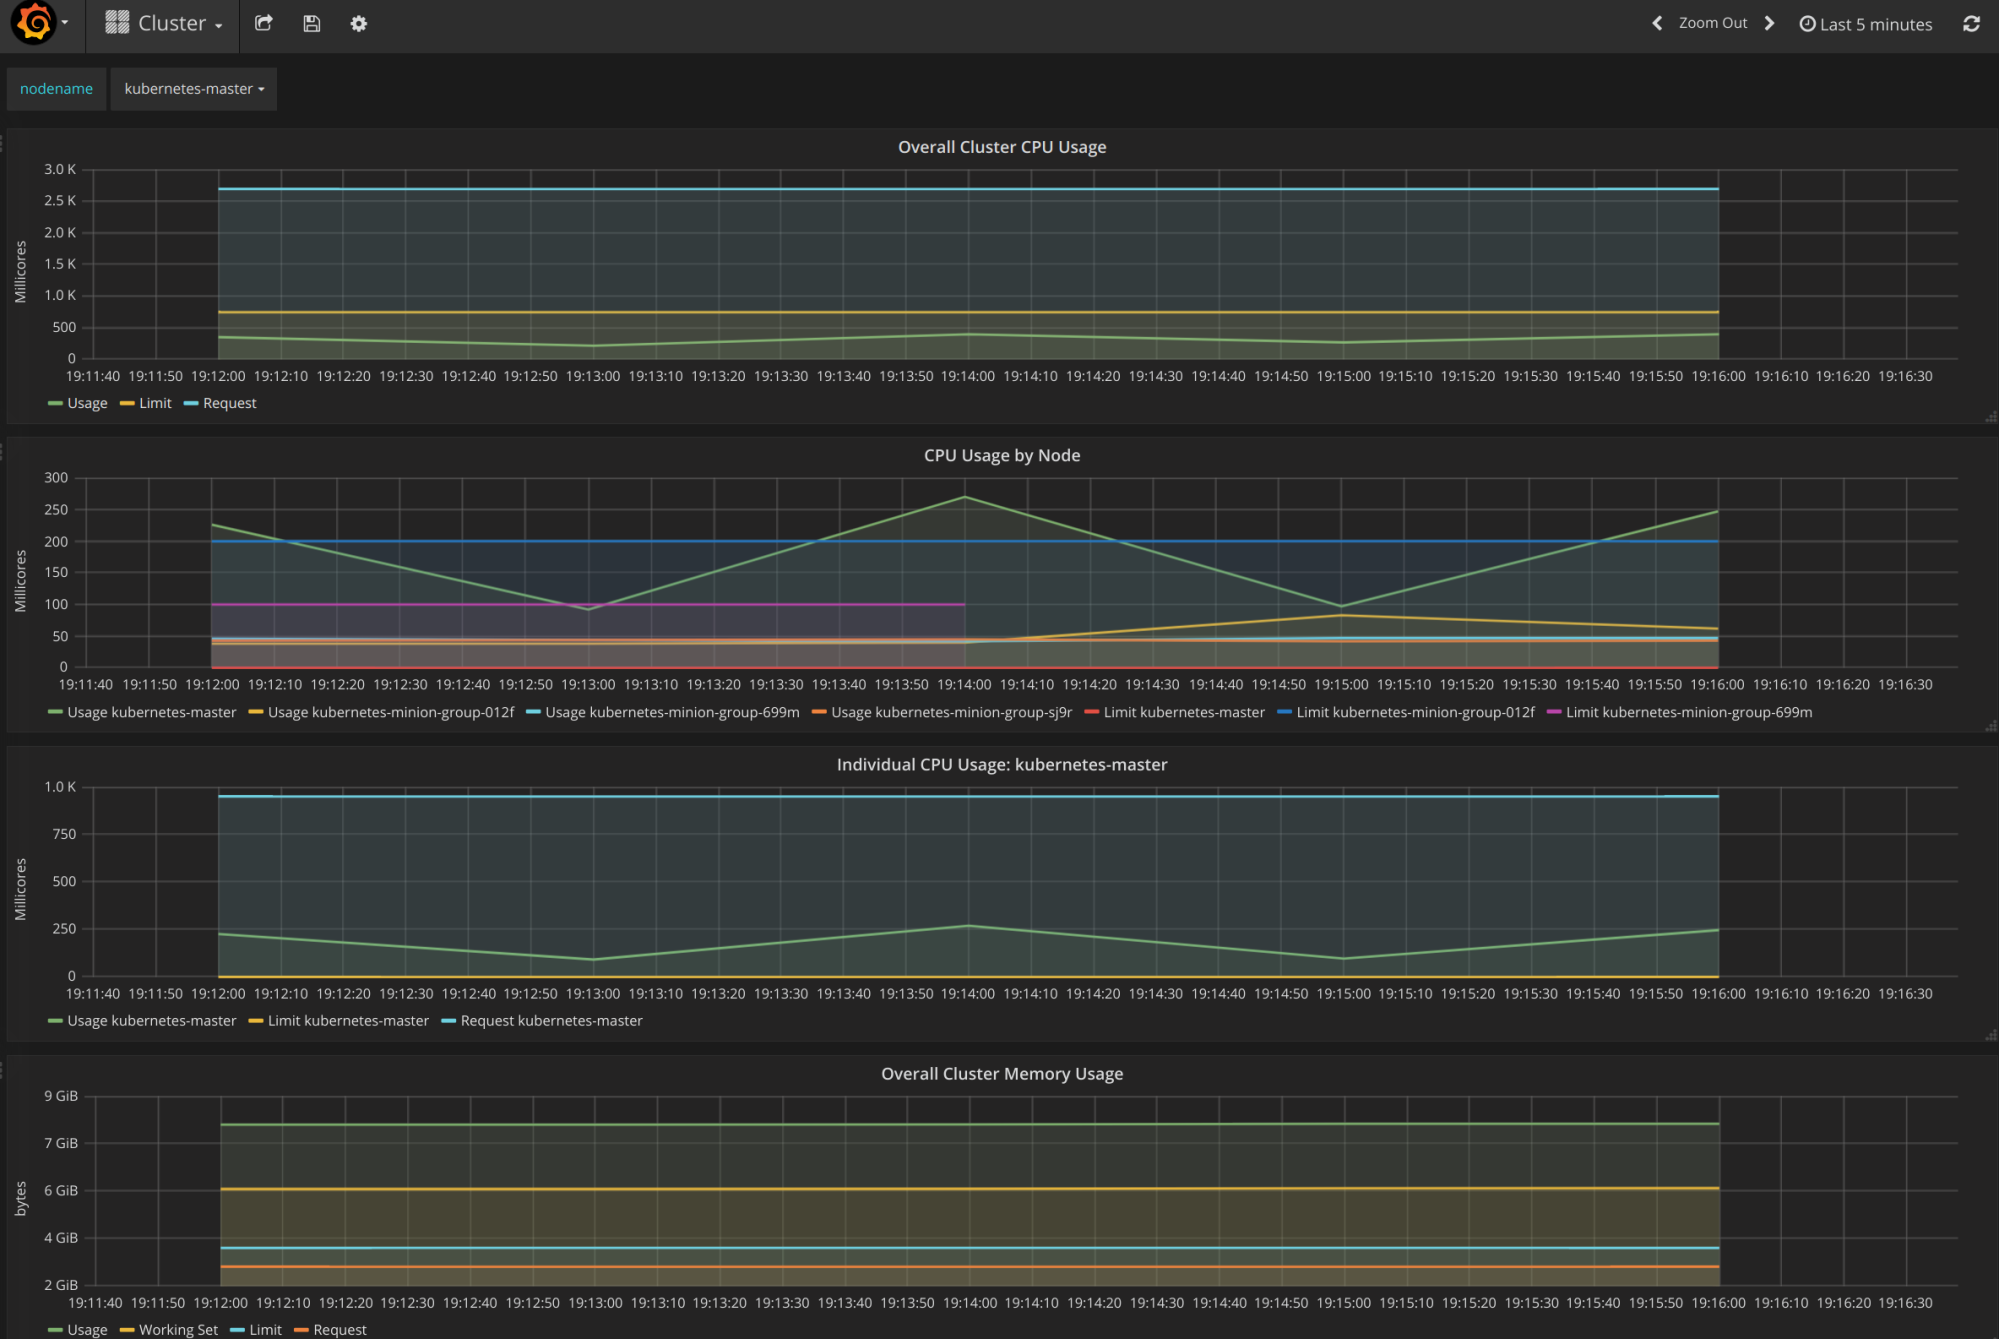
From the main page, click on the Home drop-down and select Cluster. Here, Kubernetes is actually running a number of services. Heapster is used to collect the resource usage on the pods and nodes, and stores the information in InfluxDB. The results, such as CPU and memory usage, are what we see in the Grafana UI. We will explore this in depth in Chapter 7, Monitoring and Logging.
Command line
The kubectl script has commands for exploring our cluster and the workloads running on it. You can find it in the /kubernetes/client/bin folder. We will be using this command throughout the book, so let's take a second to set up our environment. We can do so by putting the binaries folder on our PATH, in the following manner:
$ export PATH=$PATH:/<Path where you downloaded K8s>/kubernetes/client/bin
$ chmod +x /<Path where you downloaded K8s>/kubernetes/client/bin
Note
You may choose to download the kubernetes folder outside your home folder, so modify the preceding command as appropriate. It is also a good idea to make the changes permanent by adding the export command to the end of your .bashrc file in your home directory.
Now that we have kubectl on our path, we can start working with it. It has quite a few commands. Since we have not spun up any applications yet, most of these commands will not be very interesting. However, we can explore two commands right away.
First, we have already seen the cluster-info command during initialization, but we can run it again at any time with the following command:
$ kubectl cluster-infoAnother useful command is get. It can be used to see currently running services, pods, replication controllers, and a lot more. Here are the three examples that are useful right out of the gate:
- Lists the nodes in our cluster:
$ kubectl get nodes- Lists cluster events:
$ kubectl get events- Finally, we can see any services that are running in the cluster, as follows:
$ kubectl get servicesTo start with, we will only see one service, named kubernetes. This service is the core API server for the cluster.
For any of the preceding commands, you can always add a -h flag on the end to understand the intended usage.
Services running on the master
Let's dig a little bit deeper into our new cluster and its core services. By default, machines are named with the kubernetes- prefix. We can modify this using $KUBE_GCE_INSTANCE_PREFIX before a cluster is spun up. For the cluster we just started, the master should be named kubernetes-master. We can use the gcloud command-line utility to SSH into the machine. The following command will start an SSH session with the master node. Be sure to substitute your project ID and zone to match your environment:
$ gcloud compute ssh --zone "<your gce zone>" "kubernetes-master"

$ gcloud compute ssh --zone "us-central1-b" "kubernetes-master"
Warning: Permanently added 'compute.5419404412212490753' (RSA) to the list of known hosts.

Welcome to Kubernetes v1.9.4!

You can find documentation for Kubernetes at:
  http://docs.kubernetes.io/

The source for this release can be found at:
  /home/kubernetes/kubernetes-src.tar.gz
Or you can download it at:
  https://storage.googleapis.com/kubernetes-release/release/v1.9.4/kubernetes-src.tar.gz

It is based on the Kubernetes source at:
  https://github.com/kubernetes/kubernetes/tree/v1.9.4

For Kubernetes copyright and licensing information, see:
  /home/kubernetes/LICENSES

jesse@kubernetes-master ~ $
Note
If you have trouble with SSH via the Google Cloud CLI, you can use the console, which has a built-in SSH client. Simply go to the VM instances details page and you'll see an SSH option as a column in the kubernetes-master listing. Alternatively, the VM instance details page has the SSH option at the top.
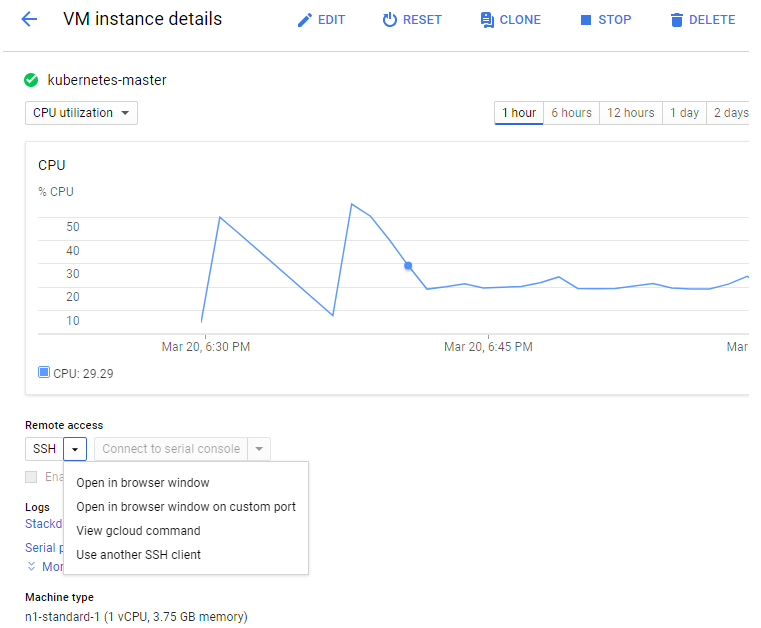
Once we are logged in, we should get a standard shell prompt. Let's run the docker command that filters for Image and Status:
$ docker container ls --format 'table {{.Image}}\t{{.Status}}' 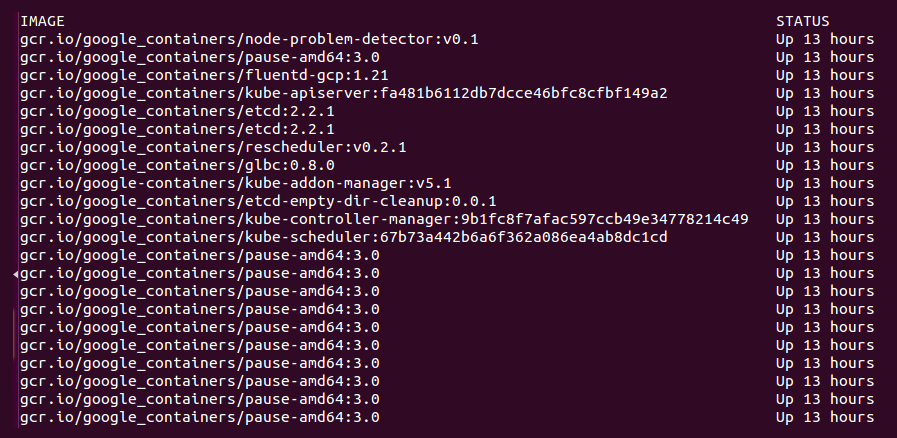
Even though we have not deployed any applications on Kubernetes yet, we can note that there are several containers already running. The following is a brief description of each container:
fluentd-gcp: This container collects and sends the cluster logs file to the Google Cloud Logging service.node-problem-detector: This container is a daemon that runs on every node and currently detects issues at the hardware and kernel layer.rescheduler: This is another add-on container that makes sure critical components are always running. In cases of low resource availability, it may even remove less critical pods to make room.glbc: This is another Kubernetes add-on container that provides Google Cloud Layer 7 load balancing using the new Ingress capability.kube-addon-manager: This component is core to the extension of Kubernetes through various add-ons. It also periodically applies any changes to the/etc/kubernetes/addonsdirectory.etcd-empty-dir-cleanup: A utility to clean up empty keys inetcd.
kube-controller-manager: This is a controller manager that controls a variety of cluster functions, ensuring accurate and up-to-date replication is one of its vital roles. Additionally, it monitors, manages, and discovers new nodes. Finally, it manages and updates service endpoints.kube-apiserver: This container runs the API server. As we explored in the Swagger interface, this RESTful API allows us to create, query, update, and remove various components of our Kubernetes cluster.kube-scheduler: This scheduler takes unscheduled pods and binds them to nodes based on the current scheduling algorithm.etcd: This runs theetcdsoftware built by CoreOS, and it is a distributed and consistent key-value store. This is where the Kubernetes cluster state is stored, updated, and retrieved by various components of K8s.pause: This container is often referred to as the pod infrastructure container and is used to set up and hold the networking namespace and resource limits for each pod.
Note
I omitted the amd64 for many of these names to make this more generic. The purpose of the pods remains the same.
To exit the SSH session, simply type exit at the prompt.
Note
In the next chapter, we will also show how a few of these services work together in the first image, Kubernetes core architecture.
Services running on the minions
We could SSH to one of the minions, but since Kubernetes schedules workloads across the cluster, we would not see all the containers on a single minion. However, we can look at the pods running on all the minions using the kubectl command:
$ kubectl get pods
No resources found.
Since we have not started any applications on the cluster yet, we don't see any pods. However, there are actually several system pods running pieces of the Kubernetes infrastructure. We can see these pods by specifying the kube-system namespace. We will explore namespaces and their significance later, but for now, the --namespace=kube-system command can be used to look at these K8s system resources, as follows:
$ kubectl get pods --namespace=kube-system
jesse@kubernetes-master ~ $ kubectl get pods --namespace=kube-system
NAME READY STATUS RESTARTS AGE
etcd-server-events-kubernetes-master 1/1 Running 0 50m
etcd-server-kubernetes-master 1/1 Running 0 50m
event-exporter-v0.1.7-64464bff45-rg88v 1/1 Running 0 51m
fluentd-gcp-v2.0.10-c4ptt 1/1 Running 0 50m
fluentd-gcp-v2.0.10-d9c5z 1/1 Running 0 50m
fluentd-gcp-v2.0.10-ztdzs 1/1 Running 0 51m
fluentd-gcp-v2.0.10-zxx6k 1/1 Running 0 50m
heapster-v1.5.0-584689c78d-z9blq 4/4 Running 0 50m
kube-addon-manager-kubernetes-master 1/1 Running 0 50m
kube-apiserver-kubernetes-master 1/1 Running 0 50m
kube-controller-manager-kubernetes-master 1/1 Running 0 50m
kube-dns-774d5484cc-gcgdx 3/3 Running 0 51m
kube-dns-774d5484cc-hgm9r 3/3 Running 0 50m
kube-dns-autoscaler-69c5cbdcdd-8hj5j 1/1 Running 0 51m
kube-proxy-kubernetes-minion-group-012f 1/1 Running 0 50m
kube-proxy-kubernetes-minion-group-699m 1/1 Running 0 50m
kube-proxy-kubernetes-minion-group-sj9r 1/1 Running 0 50m
kube-scheduler-kubernetes-master 1/1 Running 0 50m
kubernetes-dashboard-74f855c8c6-v4f6x 1/1 Running 0 51m
l7-default-backend-57856c5f55-2lz6w 1/1 Running 0 51m
l7-lb-controller-v0.9.7-kubernetes-master 1/1 Running 0 50m
metrics-server-v0.2.1-7f8dd98c8f-v9b4c 2/2 Running 0 50m
monitoring-influxdb-grafana-v4-554f5d97-l7q4k 2/2 Running 0 51m
rescheduler-v0.3.1-kubernetes-master 1/1 Running 0 50m
The first six lines should look familiar. Some of these are the services we saw running on the master, and we will see pieces of these on the nodes. There are a few additional services we have not seen yet. The kube-dns option provides the DNS and service discovery plumbing, kubernetes-dashboard-xxxx is the user interface for Kubernetes, l7-default-backend-xxxx provides the default load balancing backend for the new layer-7 load balancing capability, and heapster-v1.2.0-xxxx and monitoring-influx-grafana provide the Heapster database and user interface to monitor resource usage across the cluster.
Finally, kube-proxy-kubernetes-minion-group-xxxx is the proxy, which directs traffic to the proper backing services and pods running on our cluster. The kube-apiserver validates and configures data for the API objects, which include services, replication controllers, pods, and other Kubernetes objects. The rescheduler guarantees the scheduling of critical system add-ons, given that the cluster has enough available resources.
If we did SSH into a random minion, we would see several containers that run across a few of these pods. A sample might look like the following:
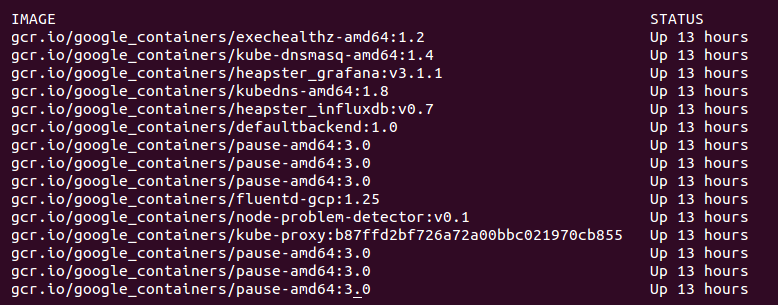
Again, we saw a similar lineup of services on the master. The services we did not see on the master include the following:
kubedns: This container monitors the service and endpoint resources in Kubernetes and synchronizes any changes to DNS lookups.kube-dnsmasq: This is another container that provides DNS caching.dnsmasq-metrics: This provides metric reporting for DNS services in cluster.l7-defaultbackend: This is the default backend for handling the GCE L7 load balancer and Ingress.kube-proxy: This is the network and service proxy for your cluster. This component makes sure that service traffic is directed to wherever your workloads are running on the cluster. We will explore this in more depth later in this book.heapster: This container is for monitoring and analytics.addon-resizer: This cluster utility is for scaling containers.
heapster_grafana: This tracks resource usage and monitoring.heapster_influxdb: This time series database is for Heapster data.cluster-proportional-autoscaler: This cluster utility is for scaling containers in proportion to the cluster size.exechealthz: This performs health checks on the pods.
Note
Again, I have omitted the amd64 for many of these names to make this more generic. The purpose of the pods remains the same.
Tearing down a cluster
Alright, this is our first cluster on GCE, but let's explore some other providers. To keep things simple, we need to remove the one we just created on GCE. We can tear down the cluster with one simple command:
$ cluster/kube-down.sh


